Skip to content

What does a student learn in ?

This is the year math stretches past the basics into the tools used in college and on the job. Students work with imaginary numbers, vectors, and matrices, and they push deeper into functions like logarithms, trig, and rational expressions. Statistics gets serious too, with normal curves, sampling, and expected value. By spring, students can solve a quadratic with complex answers, graph a logarithmic or trig function by hand, and read a poll's margin of error with a clear eye.

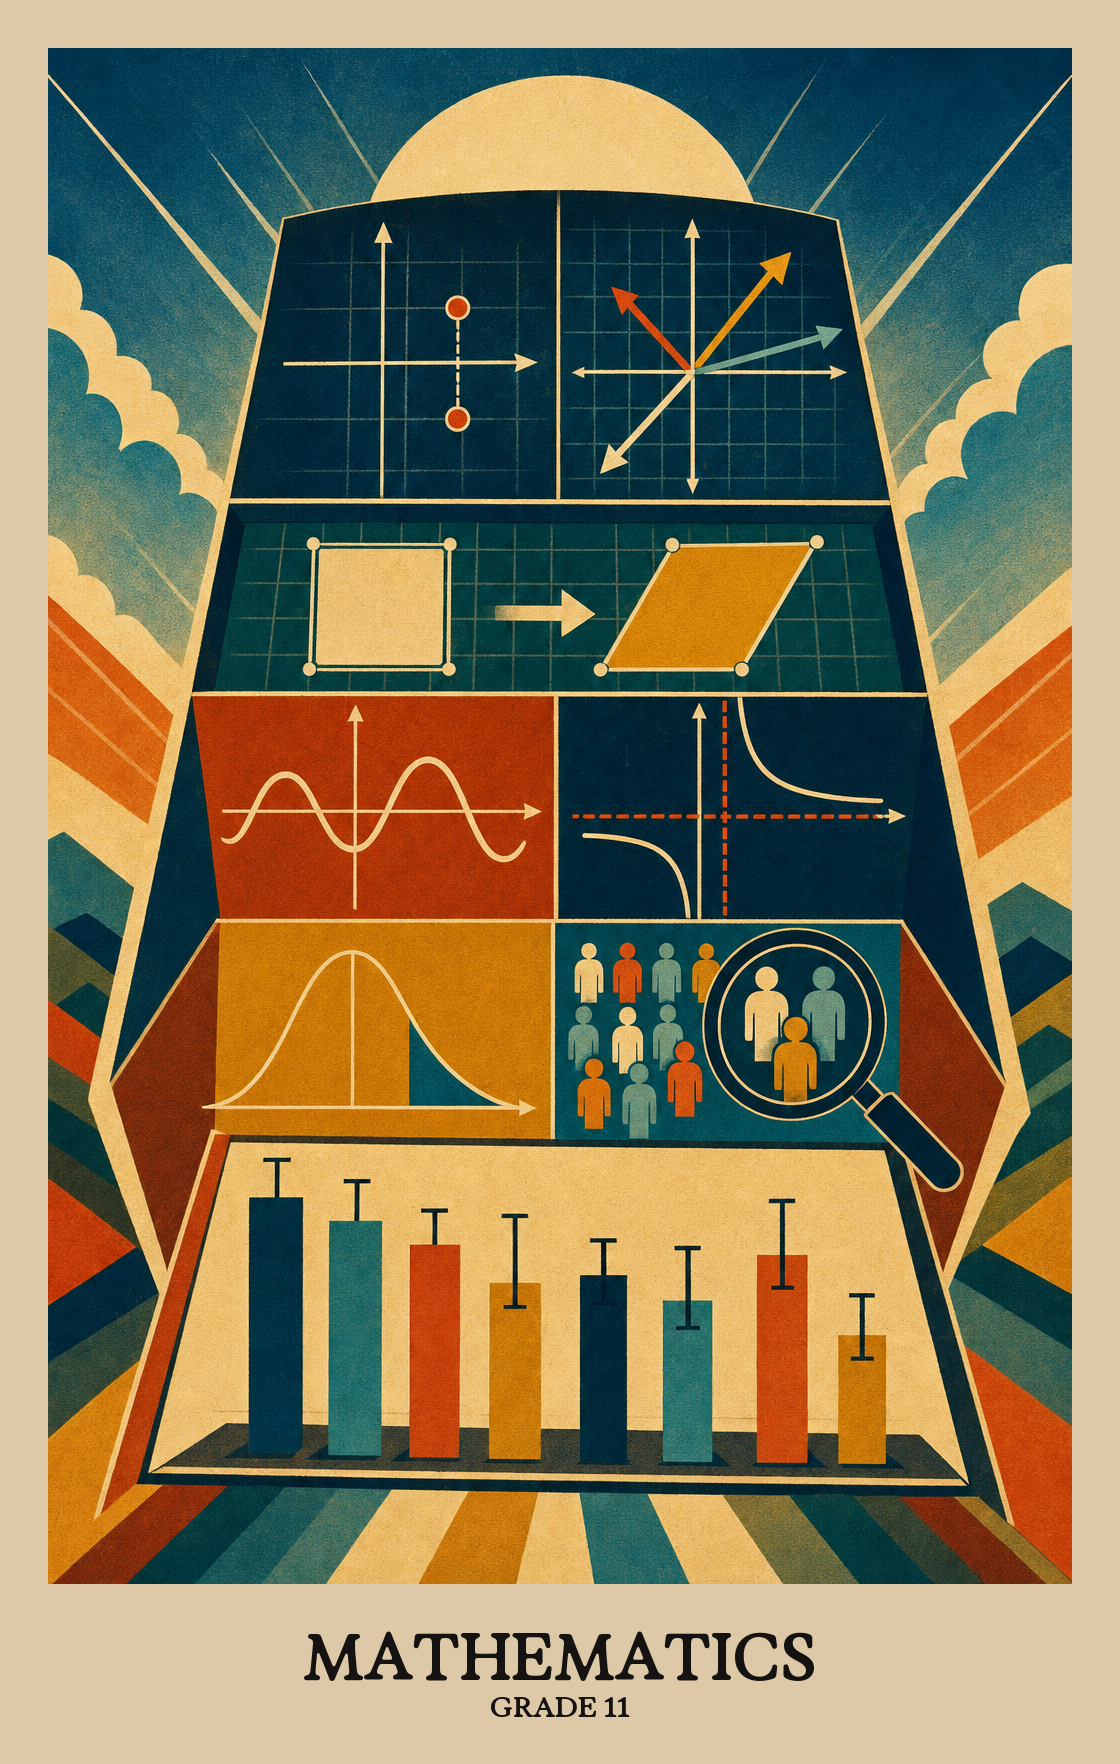
Illustration of what students learn in Grade 11 Mathematics
  • Complex numbers
  • Vectors and matrices
  • Logarithms
  • Trigonometry
  • Conic sections
  • Probability and expected value
  • Sampling and inference
Source: Kansas Kansas Standards
Year at a glance
How the year usually goes. Every school and district set their own curriculum, so treat this as a guide, not official pacing.
  1. 1

    Expressions, exponents, and complex numbers

    Students stretch what they know about exponents to include fractions and roots, and they meet a new kind of number that lets every quadratic have a solution. Expect work with radicals, rewriting expressions, and the number i.

  2. 2

    Polynomials and rational expressions

    Students factor and divide polynomials, work with fractions that have variables on top and bottom, and use the Remainder Theorem to find roots. Expect longer algebra problems that build on past factoring work.

  3. 3

    Functions, graphs, and modeling

    Students graph and compare many function families, including square root, exponential, logarithmic, and rational. They shift and stretch graphs, find inverses, and use functions to model real situations like growth and decay.

  4. 4

    Trigonometry and the unit circle

    Students measure angles in radians, use the unit circle to extend sine and cosine to all real numbers, and model repeating patterns like tides or sound. They also prove identities and solve triangles with the Laws of Sines and Cosines.

  5. 5

    Vectors, matrices, and conic sections

    Students treat arrows with size and direction as vectors, organize numbers into matrices to solve systems, and write equations for circles, parabolas, ellipses, and hyperbolas. Expect a mix of algebra and geometry.

  6. 6

    Statistics, probability, and decisions

    Students fit data to curves, judge surveys and experiments, and use probability to weigh real decisions. They work with conditional probability, expected value, and the normal curve to reason about uncertainty.

Mastery Learning Standards
The required skills a student should display by the end of Grade 11.
Number and Quantity
  • Explain how the definition of the meaning of rational exponents follows from…

    N.RN.2

    Rewriting a radical like the square root of 5 as 5 to the power of one-half is a shorthand that follows the same multiplication rules students already know for whole-number exponents. Students practice moving between radical notation and fractional exponent notation to show those rules hold up.

  • Rewrite expressions involving radicals and rational exponents using the…

    N.RN.3

    Rewriting a square root like √8 as a fraction exponent (8^½) lets students simplify and combine messy expressions using the same exponent rules they already know. This skill shows up in algebra, physics, and any equation with roots.

  • Use units as a way to understand problems and to guide the solution of…

    N.Q.1

    Reading a graph or solving a multi-step problem often hinges on picking the right units and scale. Students choose units that fit the situation, apply them consistently through each step, and explain what the numbers on a graph's axes actually mean.

  • Define appropriate quantities for the purpose of descriptive modeling

    N.Q.2

    Students choose which numbers to track when modeling a real situation. If they're studying traffic patterns, they decide whether to measure cars per minute, total wait time, or something else entirely.

  • Choose a level of accuracy appropriate to limitations on measurement when…

    N.Q.3

    When reporting a measurement, students pick a level of precision that makes sense given the tool used. A ruler marked in inches shouldn't produce an answer down to the thousandth of an inch.

  • Know there is a complex number i such that i² = -1

    N.CN.1

    Imaginary numbers extend the number line into new territory. Students learn that i is defined as the square root of -1, and that every complex number is a real part plus a real number multiplied by i.

  • Use the relation i² = -1 and the commutative, associative

    N.CN.2

    Adding, subtracting, and multiplying complex numbers works like regular algebra, with one rule: whenever i² appears, replace it with -1. Students apply that rule to simplify expressions that include an imaginary part.

  • Find the conjugate of a complex number

    N.CN.3

    Finding the conjugate of a complex number means flipping the sign on the imaginary part. Students use this to simplify division problems that involve square roots of negative numbers.

  • Use conjugates to find moduli and quotients of complex numbers

    N.CN.4

    Students use a number's mirror image across the real axis to calculate its distance from the origin and to divide one complex number by another. This is the arithmetic behind simplifying fractions that have complex numbers in the denominator.

  • Represent complex numbers on the complex plane in rectangular and polar form

    N.CN.5

    Students plot complex numbers on a coordinate grid using either rectangular coordinates (a real part and an imaginary part) or polar coordinates (a distance and an angle). They explain why both methods point to the same number.

  • Represent addition, subtraction, multiplication

    N.CN.6

    Students plot complex numbers on a coordinate grid and use the geometry of that picture to add, subtract, multiply, and find conjugates. The visual layout becomes a calculation tool, not just a diagram.

  • Calculate the distance between numbers in the complex plane as the modulus of…

    N.CN.7

    Students find the distance between two complex numbers the same way they'd measure a gap on a coordinate grid, by calculating the size of their difference. They also find the midpoint of a segment by averaging the two endpoint values.

  • Solve quadratic equations with real coefficients that have complex solutions

    N.CN.8

    Quadratic equations don't always have neat whole-number answers. Students solve equations like x² + 4 = 0 where the solutions involve imaginary numbers, writing answers in the form a + bi.

  • Extend polynomial identities to the complex numbers

    N.CN.9

    Polynomial identities like (a + b)² = a² + 2ab + b² still hold when a and b are complex numbers. Students apply familiar algebra rules to expressions that include imaginary parts.

  • Know the Fundamental Theorem of Algebra

    N.CN.10

    The Fundamental Theorem of Algebra says every polynomial equation has at least one solution, even if that solution is a complex number. Students prove this holds for quadratic equations by finding both roots, real or complex.

  • Recognize vector quantities as having both magnitude and direction

    N.VM.1

    A vector is more than just a size. Students learn that vectors carry both a length and a direction, then write them as arrows and label them with the correct notation.

  • Find the components of a vector by subtracting the coordinates of an initial…

    N.VM.2

    A vector is an arrow on a graph with a start point and an end point. Students find its horizontal and vertical reach by subtracting the starting coordinates from the ending coordinates.

  • Solve problems involving velocity and other quantities that can be represented…

    N.VM.3

    Vectors describe quantities that have both size and direction, like a car moving 60 mph northeast. Students use them to solve problems involving speed, force, or anything that points somewhere.

  • Add and subtract vectors

    N.VM.4

    Students add and subtract vectors by combining arrows that show direction and distance. They work with vectors on a coordinate grid and learn that changing the order of addition doesn't change the result.

  • Add vectors end-to-end, component-wise

    N.VM.4.a

    Students add two vectors by lining them up tip-to-tail, by adding their components, or by completing a parallelogram. They also learn why the combined length is usually shorter than simply adding the two original lengths.

  • Given two vectors in magnitude and direction form, determine the magnitude and…

    N.VM.4.b

    Two vectors point in different directions with different strengths. Students add them to find one combined vector, then calculate how strong that combined pull is and which direction it points.

  • Understand vector subtraction v - w as v +

    N.VM.4.c

    Vector subtraction means flipping one vector to face the opposite direction, then adding it to the other. Students calculate this by reversing each component's sign and adding, and can check the result by drawing both arrows tip to tip on a graph.

  • Multiply a vector by a scalar

    N.VM.5

    Students multiply a vector (an arrow that has both size and direction) by a plain number to stretch, shrink, or flip it. The direction may stay the same or reverse; the number scales how far the arrow reaches.

  • Represent scalar multiplication graphically by scaling vectors and possibly…

    N.VM.5.a

    Scalar multiplication stretches or shrinks a vector arrow by a number, and flips its direction if that number is negative. Students also do this by multiplying each component separately: double the vector (3, 4) and you get (6, 8).

  • Compute the magnitude of a scalar multiple cv using ||cv|| = |c|v

    N.VM.5.b

    Multiplying a vector by a number stretches or shrinks its length by that factor. If the number is positive, the vector still points the same way; if negative, it flips to point the opposite direction.

  • Use matrices to represent and manipulate data

    N.VM.6

    Matrices are grids of numbers that help students organize and work with complex data. Students use them to track relationships, like which locations connect in a network or which outcomes follow from a set of choices.

  • Multiply matrices by scalars to produce new matrices

    N.VM.7

    Students multiply every number in a matrix by a single value to scale the whole grid up or down. Think of it like doubling every price on a menu at once.

  • Add, subtract, and multiply matrices of appropriate dimensions

    N.VM.8

    Students add, subtract, and multiply grids of numbers (called matrices) when the sizes line up correctly. They also calculate a single summary number, called a determinant, from any two-by-two grid.

  • Understand that, unlike multiplication of numbers, matrix multiplication for…

    N.VM.9

    Multiplying matrices is different from multiplying regular numbers: switching the order of two matrices usually gives a different answer. But matrices still follow the same grouping and distribution rules students learned with numbers.

  • Understand that the zero and identity matrices play a role in matrix addition…

    N.VM.10

    Two special matrices work like 0 and 1 do in regular arithmetic: one leaves any matrix unchanged, the other zeros it out. Students also learn when a square matrix can be "divided" by checking whether its determinant equals zero.

  • Multiply a vector (regarded as a matrix with one column) by a matrix of…

    N.VM.11

    Students multiply a vector by a matrix to produce a new vector, then study how matrices shift, stretch, or rotate that vector in space. This connects matrix arithmetic to real geometric change.

Algebra
  • Interpret expressions that represent a quantity in terms of its context

    A.SSE.1

    Reading a math expression is like reading a sentence: every part means something. Students learn to look at a formula or equation and explain what each number, variable, or grouping actually represents in the real situation it describes.

  • Interpret parts of an expression, such as terms, factors

    A.SSE.1.a

    An algebraic expression is a math phrase built from parts. Students learn what each piece means: a number out front (the coefficient), a group being multiplied (a factor), and a chunk being added or subtracted (a term).

  • Interpret complicated expressions by viewing one or more of their parts as a…

    A.SSE.1.b

    A complex math expression can have chunks inside it that act as one piece. Students learn to spot those chunks and read what they mean, the way you might see "monthly payment x 12" as a yearly total instead of doing each step separately.

  • Use the structure of an expression to identify ways to rewrite it

    A.SSE.2

    Students look at an algebraic expression and spot a pattern that lets them rewrite it in a simpler or more useful form. Recognizing that x⁴ minus 1 works like a difference of squares, for example, is the kind of move this standard builds.

  • Choose and produce an equivalent form of an expression to reveal and explain…

    A.SS.3

    Students rewrite an expression (like a quadratic or exponential) into a different but equal form to make a hidden property visible, such as a maximum value or a growth rate.

  • Complete the square in a quadratic expression to reveal the maximum or minimum…

    A.SS.3.b

    Students rewrite a quadratic expression by completing the square, which shifts the equation into a form that shows exactly where the highest or lowest point of the curve sits.

  • Use the properties of exponents to transform expressions for exponential…

    A.SS.3.c

    Students rewrite exponential expressions by applying exponent rules, such as turning 1.15^(12t) into (1.15^12)^t to reveal a yearly growth rate hidden in a monthly formula.

  • Factor higher degree polynomials

    A.APR.2

    Students factor expressions like x³ + 2x² - 5x - 6 by finding what multiplies together to make them. Some polynomials can't be broken down further, the way 7 can't be divided evenly into smaller whole numbers.

  • Know and apply the Remainder Theorem

    A.APR.3

    When dividing a polynomial by (x - c), the remainder equals the polynomial's value at x = c. If that value is zero, then (x - c) divides it evenly, making it a factor.

  • Generate polynomial identities from a pattern

    A.APR.4

    Students spot a repeating pattern in polynomial expressions and write a general rule that works every time, like turning a specific example into a formula that holds for all numbers.

  • Know and apply the Binomial Theorem for the expansion of

    A.APR.5

    Students use Pascal's Triangle or a formula to expand expressions like (x + y) raised to a whole-number power without multiplying the whole thing out by hand.

  • Rewrite simple rational expressions in different forms

    A.APR.6

    Students divide one polynomial expression by another and rewrite the result as a simpler expression plus a remainder fraction. It works the same way long division works with whole numbers.

  • Add, subtract, multiply

    A.APR.7

    Students add, subtract, multiply, and divide fractions that contain variables instead of plain numbers. The algebra is the same as fraction arithmetic, just with expressions like (x + 2) in the numerator or denominator.

  • Apply and extend previous understanding to create equations and inequalities in…

    A.CED.1

    Students write an equation or inequality with one unknown to model a real situation, then solve it. This builds on the algebra they already know, pushing toward more complex relationships like exponential or rational ones.

  • Apply and extend previous understanding to create equations in two or more…

    A.CED.2

    Students write an equation that connects two changing quantities (like time and distance) and plot it on a labeled graph. The graph shows how one value shifts as the other changes.

  • Represent constraints by equations or inequalities

    A.CED.3

    Students translate real-world limits into equations or inequalities, then check whether the answers actually make sense for the situation. A solution that works on paper but not in real life gets flagged as unusable.

  • Rearrange formulas to highlight a quantity of interest, using the same…

    A.CED.4

    A formula like d = r × t holds several unknowns at once. Students rewrite it to isolate whichever variable they need, using the same steps they'd use to solve any equation.

  • Explain each step in solving a simple equation as following from the equality…

    A.REI.1

    Solving an equation is more than finding the answer. Students explain why each step is valid, showing how one line of algebra follows logically from the last.

  • Apply and extend previous understanding to solve equations, inequalities

    A.REI.2

    Students solve equations and inequalities that have one unknown, including formulas where letters stand in for numbers. They rearrange those formulas to isolate any variable they need.

  • Solve equations in one variable and give examples showing how extraneous…

    A.REI.3

    Solving an equation with one unknown, like finding the value of x that makes both sides balance. Students also learn to spot "extra" answers that look correct but don't actually work when plugged back in.

  • Solve rational, absolute value and square root equations

    A.REI.3.a

    Solving equations that include square roots, fractions, or absolute values. Students isolate the variable step by step, checking that each solution actually works in the original equation.

  • Solve exponential and logarithmic equations

    A.REI.3.b

    Students solve equations where the unknown appears as an exponent (like 2 to the power of x) or inside a logarithm. They use inverse operations to isolate the variable and find the solution.

  • Solve radical and rational exponent equations and inequalities in one variable

    A.REI.4

    Students solve equations that contain square roots or fractional exponents, then check whether each answer actually works in the original equation. Some answers look correct but fall apart when plugged back in.

  • Solve quadratic equations and inequalities

    A.REI.5

    Solving a quadratic equation means finding the values of x that make an expression like x² + 3x - 4 equal zero. Students also solve inequalities to find the range of values where the expression is greater or less than zero.

  • Solve quadratic equations with complex solutions written in the form a ± bi for…

    A.REI.5.b

    Solving a quadratic equation sometimes produces no real answer. Students learn to write those solutions using imaginary numbers, expressing the result in the form a ± bi instead of leaving the equation unsolved.

  • Use the method of completing the square to transform and solve any quadratic…

    A.REI.5.c

    Completing the square is a method for rewriting a quadratic equation so one side is a perfect square. Students use it to solve equations that resist simpler factoring.

  • Solve quadratic inequalities and identify the domain

    A.REI.5.d

    Students solve inequalities where the variable is squared, then state which x-values make the inequality true. The work combines factoring or the quadratic formula with number-line testing to find the solution range.

  • Represent a system of linear equations as a single matrix equation and solve

    A.REI.7

    Students set up a system of three or more linear equations as a matrix equation, then use a calculator or software to solve for the unknown values. It connects algebra to a method used in engineering and data work.

  • Understand that the graph of an equation in two variables is the set of all its…

    A.REI.8

    Graphing an equation means plotting every point that makes it true. Students learn that those points, taken together, form a line or curve on the coordinate plane.

  • Solve an equation f(x) = g

    A.REI.9

    Students find where two graphed lines or curves cross, then read off the x-value at that intersection to solve an equation. This works whether the graphs are straight lines, curves, or more complex shapes.

Functions
  • Understand that a function from one set

    F.IF.1

    A function is a rule that gives exactly one output for every input. Students learn to read f(x) as "the output when x goes in" and connect that rule to what a graph of the same equation looks like.

  • Use function notation, evaluate functions for inputs in their domains

    F.IF.2

    Students read and use function notation like f(x) to find an output when given an input, then explain what the result means in a real situation, such as what f(3) = 12 tells you about a problem.

  • Recognize patterns in order to write functions whose domain is a subset of the…

    F.IF.3

    Students identify a pattern in a sequence of numbers and write a rule that predicts any term in that sequence. The rule can be a straight-line or curved relationship, and the inputs are always whole numbers.

  • For a function that models a relationship between two quantities, interpret key…

    F.IF.4

    Given a graph or table that shows how two quantities relate, students identify where the graph crosses the axes, where it rises or falls, and what happens at its peaks, valleys, and edges.

  • Relate the domain of a function to its graph and, where applicable, to the…

    F.IF.5

    The domain is the set of inputs a function will accept. Students look at a graph or a real-world situation (like hours worked or ticket prices) and identify which input values make sense given the context.

  • Calculate and interpret the average rate of change of a function

    F.IF.6

    Students find how fast a value rises or falls over a stretch of time or distance, using a formula, a table of numbers, or a graph. That rate tells them whether something is speeding up, slowing down, or staying steady.

  • Graph functions expressed symbolically and show key features of the graph, by…

    F.IF.7

    Students graph equations by hand or with a calculator and label the key features: where the line crosses an axis, where it peaks or bottoms out, and how it behaves at the edges.

  • Graph square root, cube root

    F.IF.7.b

    Students graph square root, cube root, and exponential curves by hand or with technology, plotting key points and sketching the shape each equation produces.

  • Graph logarithmic functions, emphasizing the inverse relationship with…

    F.IF.7.c

    Students graph logarithmic functions by hand and with technology, marking where the curve crosses the axes and describing what happens at each end. The work builds directly on exponential graphs, since a log function is its mirror image flipped across the line y = x.

  • Graph piecewise-defined functions, including step functions

    F.IF.7.d

    Students graph functions that change rules at different points, such as a flat shipping rate that jumps at certain order sizes. Step functions are one example, where the output holds steady, then jumps to a new value.

  • Graph polynomial functions, identifying zeros when suitable factorizations are…

    F.IF.7.e

    Students graph polynomial functions by hand or with technology, marking where the curve crosses zero and describing whether the ends of the graph rise or fall.

  • Graph rational functions, identifying zeros and asymptotes when suitable…

    F.IF.7.f

    Students graph rational functions (fractions with polynomials on top and bottom), marking where the graph crosses zero and where it shoots toward a vertical or horizontal line it never quite reaches.

  • Graph trigonometric functions, showing period, midline

    F.IF.7.g

    Students graph sine, cosine, and similar wave-shaped functions on a coordinate plane. They label how tall the wave gets, where the middle sits, and how long one full cycle takes.

  • Write a function in different but equivalent forms to reveal and explain…

    F.IF.8

    Students rewrite the same function in different forms, such as factored or completed-square form, to spot useful details like the highest or lowest point of a graph or where it crosses zero.

  • Use the process of factoring and completing the square in a quadratic function…

    F.IF.8.b

    Factoring or completing the square on a quadratic equation reveals where the graph crosses zero, where it peaks or bottoms out, and where its line of symmetry falls. Students then explain what those points mean in a real situation.

  • Use the properties of exponents to interpret expressions for exponential…

    F.IF.8.c

    Reading an exponential expression like 2^(0.1t) means recognizing what the base and exponent actually tell you. Students rewrite or analyze these expressions to explain the growth rate, starting value, or pattern a function describes.

  • Compare properties of two functions using a variety of representations

    F.IF.9

    Students compare two functions side by side, whether they're written as equations, shown on a graph, listed in a table, or described in words, to spot differences in slope, intercepts, or other key features.

  • Use functions to model real-world relationships

    F.BF.1

    Students pick a situation from real life, like the cost of filling a gas tank or the height of a bouncing ball, and write a function that captures how one quantity changes as another changes.

  • Determine an explicit expression , a recursive function

    F.BF.1.b

    Given a real situation (a savings account, a bouncing ball, a growing pattern), students write a formula or step-by-step rule that describes what's happening mathematically.

  • Compose functions

    F.BF.1.c

    Students combine two functions into one by plugging the output of the first function into the second. For example, if one rule converts miles to kilometers and another converts kilometers to steps, students build a single rule that goes straight from miles to steps.

  • Write arithmetic and geometric sequences and series both recursively and with…

    F.BF.2

    Students write number patterns as both a step-by-step rule (each term based on the last) and a direct formula (any term from its position alone). They also match those formulas to real situations, like steady growth or repeated doubling.

  • Transform parent functions

    F.BF.3

    Students learn how shifting, stretching, or flipping a graph changes its equation. They practice spotting those changes on a graph and writing the algebra that matches.

  • Find inverse functions

    F.BF.4

    Students work backward from a function's output to find its input, then write that process as a new function. It's the math version of reversing directions to get back where you started.

  • Write an expression for the inverse of a function

    F.BF.4.a

    Given a function, students find the rule that reverses it. If the original turns 3 into 7, the inverse turns 7 back into 3. Students write that reverse rule as a new equation.

  • Read values of an inverse function from a graph or a table, given that the…

    F.BF.4.b

    Given a graph or table of a function, students find the input that matches a given output, essentially reading the function backward. This is how inverse functions work in practice.

  • Verify by composition that one function is the inverse of another

    F.BF.4.c

    Students check that two functions are inverses by plugging one into the other and confirming the result is just x. If f and g are true inverses, running a number through both functions in either order brings you back where you started.

  • Produce an invertible function from a non-invertible function by restricting…

    F.BF.4.d

    A function that folds back on itself has no clean reverse. Students learn to trim the input range until the function does have one, making a clean two-way relationship possible.

  • Understand the inverse relationship between exponents and logarithms and use…

    F.BF.5

    Exponents and logarithms are opposites of each other, the way multiplication and division are. Students use that relationship to solve equations where the unknown is in the exponent or buried inside a logarithm.

  • Distinguish between situations that can be modeled with linear functions and…

    F.LQE.1

    Students learn to tell apart situations where something grows by a steady amount (like saving the same dollars each week) from situations where it grows by a steady percentage (like a bank account compounding interest). They pick the right type of equation for each.

  • Prove that linear functions grow by equal differences over equal intervals

    F.LQE.1.a

    Linear functions add the same amount each step. Exponential functions multiply by the same amount each step. Students prove why each pattern holds, not just observe it.

  • Recognize situations in which one quantity changes at a constant rate per unit…

    F.LQE.1.b

    Students spot real-world situations where something grows or shrinks by the same amount at each step, like a salary that increases by the same number of dollars every year.

  • Recognize situations in which a quantity grows or decays by a constant percent…

    F.LQE.1.c

    Students spot real-world situations where something grows or shrinks by the same percentage each period, like a savings account earning 5% interest every year or a car losing 15% of its value annually.

  • Construct exponential functions, given a graph, a description of a relationship

    F.LQE.2

    Reading a graph or a table, students write the equation for a pattern that doubles, triples, or shrinks by a fixed percentage each step. The goal is moving from the picture or the numbers to the formula.

  • Understand radian measure of an angle as the length of the arc on the unit…

    F.TF.1

    Radians are a way to measure angles using arc length instead of degrees. Students learn that one radian equals the length of the radius wrapped along a circle's edge, connecting angle size to the actual distance traveled around the circle.

  • Explain how the unit circle in the coordinate plane enables the extension of…

    F.TF.2

    The unit circle is a circle with radius 1 centered at the origin. Students use it to find sine and cosine values for any angle, not just the acute angles in a right triangle, by reading the coordinates where a rotating ray meets the circle.

  • Use special triangles to determine geometrically the values of sine, cosine…

    F.TF.3

    Students use the 30-60-90 and 45-45-90 triangles to find exact sine, cosine, and tangent values for key angles. Then they use the unit circle to see how those values shift when an angle is reflected or rotated.

  • Use the unit circle to explain symmetry

    F.TF.4

    The unit circle is a circle with radius 1 centered at the origin. Students use it to explain why sine and cosine repeat their values in a predictable cycle and why some trig functions mirror each other across an axis.

  • Choose trigonometric functions to model periodic phenomena with specified…

    F.TF.5

    Students pick a sine or cosine equation to match a repeating pattern, like ocean waves or a turning wheel, by adjusting how tall, how fast, and how centered the curve needs to be.

  • Understand that restricting a trigonometric function to a domain on which it is…

    F.TF.6

    To find the inverse of a sine or cosine function, students first limit the input values to a window where the curve only goes up or only goes down. That restriction makes it possible to reverse the function and solve for the angle.

  • Use inverse functions to solve trigonometric equations that arise in modeling…

    F.TF.7

    Students use inverse trig functions to work backward from a known ratio to find the missing angle in a real-world problem, like finding the angle of a ramp or a signal wave. A calculator helps check the answer against what the situation actually allows.

  • Prove the Pythagorean identity sin²

    F.TF.8

    Students use the relationship between sine and cosine to solve for a missing trig value when they know one angle ratio and which quarter of the coordinate plane the angle sits in.

  • Prove the addition and subtraction formulas for sine, cosine

    F.TF.9

    Students prove why sin(A+B), cos(A+B), and tan(A+B) work the way they do, then use those formulas to find exact values for angles that don't appear on a standard unit circle.

Geometry
  • Given two figures, use the definition of congruence in terms of rigid motions…

    G.CO.5

    Two shapes are congruent if one can land exactly on top of the other by sliding, flipping, or rotating it. Students look at two figures and decide whether a series of those moves lines them up perfectly.

  • Demonstrate triangle congruence using rigid motion

    G.CO.6

    Two triangles are congruent when one can be flipped, slid, or rotated exactly onto the other with no stretching. Students use three shortcut rules, matching two sides and an angle, two angles and a side, or all three sides, to prove the triangles are identical.

  • Construct an equilateral triangle, a square

    G.CO.12

    Using only a compass and straightedge, students draw a perfect triangle, square, and six-sided shape that fit exactly inside a circle, with every corner touching the edge.

  • Construct arguments about triangles using theorems

    G.SRT.5

    Students use triangle rules, like the Pythagorean Theorem and parallel-line proportions, to explain why a shape must be a certain size or angle. The reasoning has to hold up as a logical argument, not just a guess.

  • Use congruence and similarity criteria for triangles to solve problems and to…

    G.SRT.6

    Students use the rules for matching or scaling triangles to solve geometry problems and explain why certain relationships in a figure must be true.

  • Derive the formula A = ½ ab sin C for the area of a triangle by drawing an…

    G.SRT.10

    Students learn to find the area of any triangle using two side lengths and the angle between them. They derive the formula by dropping a perpendicular line from one corner to the opposite side and working out why the result holds for every triangle.

  • Prove the Laws of Sines and Cosines and use them to solve problems

    G.SRT.11

    Students use two formulas that connect a triangle's angles to its side lengths to find missing measurements in any triangle, not just right triangles.

  • Understand and apply the Law of Sines and the Law of Cosines to find unknown…

    G.SRT.12

    Students use two formulas to find a missing side or angle in any triangle, not just ones with a right angle. This comes up in real problems like mapping land or figuring out the direction of a moving force.

  • Construct inscribed and circumscribed circles for triangles

    G.C.4

    Students draw a circle that fits perfectly inside a triangle and a circle that wraps exactly around the outside of one. Both constructions use a compass and straightedge to find the triangle's center points.

  • Construct inscribed and circumscribed circles for polygons and tangent lines…

    G.C.5

    Students draw a circle that fits perfectly inside a polygon and one that wraps exactly around the outside of it. They also draw lines from a point outside a circle that just graze the edge without crossing through.

  • Derive using similarity the fact that the length of the arc intercepted by an…

    G.C.6

    Students learn why a radian is just a ratio: arc length divided by radius. Then they use that relationship to find the area of a pie-slice section of a circle.

  • Derive the equation of a circle of given center and radius using the…

    G.GPE.2

    Students use the Pythagorean Theorem to write the equation of a circle when they know its center point and radius. Then they plot that circle on a coordinate grid.

  • Complete the square to find the center and radius of a circle given by an…

    G.GPE.3

    Students rewrite a circle's equation by completing the square, then read off the center point and radius directly from the rewritten form.

  • Derive the equation of a parabola given a focus and directrix

    G.GPE.4

    Students find the equation of a parabola using its focus point and directrix line, then plot the curve on a coordinate grid. This connects the geometric shape to its algebraic equation.

  • Derive the equations of ellipses and hyperbolas given the foci, using the fact…

    G.GPE.5

    Students learn where ellipses and hyperbolas come from by using the fixed distances between two focus points. They then write the equation for each curve and plot it on a coordinate grid.

Statistics & Probability
  • Use the mean and standard deviation of a data set to fit it to a normal…

    S.ID.3

    Students learn to use the average and spread of a data set to fit it to a bell curve, then estimate what percentage of a population falls in a given range. They also learn to spot data that doesn't fit that shape at all.

  • Assess the fit of a function by plotting and analyzing residuals

    S.ID.5.c

    Students plot the difference between each actual data point and the predicted value from a curve or line. If those gaps look random and small, the model fits well. If they show a pattern, it doesn't.

  • Fit quadratic and exponential functions to the data

    S.ID.5.d

    Students fit a curve (quadratic or exponential) to real data points, then use that curve to answer questions about the situation the data describes.

  • Compute (using technology) and interpret the correlation coefficient of a…

    S.ID.7

    Students use a calculator or software to find the correlation coefficient, a number between -1 and 1 that shows how closely two variables follow a straight-line pattern and whether that relationship runs up or down.

  • Distinguish between correlation and causation

    S.ID.8

    Two variables can move together without one causing the other. Students learn to tell the difference between a pattern in the data and proof that one thing actually drives the other.

  • Understand statistics as a process for making inferences to be made about…

    S.IC.1

    Statistics is a way of making educated guesses about a whole group by studying a smaller random sample. Students learn why the sample has to be random and what that sample can and cannot tell you about the larger population.

  • Decide if a specified model is consistent with results from a given…

    S.IC.2

    Students check whether a math model actually matches real data by running simulations. If the model's predictions line up with what the data shows, it's a reasonable fit. If they don't, the model needs rethinking.

  • Recognize the purposes of and differences among sample surveys, experiments

    S.IC.3

    Sample surveys ask people questions, experiments test what happens when you change something, and observational studies watch without interfering. Students learn why randomization matters in each approach and how the method shapes what conclusions you can draw.

  • Use data from a sample survey to estimate a population mean or proportion

    S.IC.4

    Students use survey results from a small group to estimate what's likely true for a much larger population. They also calculate a margin of error to show how close that estimate probably is to the real answer.

  • Use data from a randomized experiment to compare two treatments

    S.IC.5

    Students compare two groups from a real experiment, such as a new drug versus a placebo, then run simulations to decide whether the difference in results is meaningful or just random chance.

  • Evaluate reports based on data

    S.IC.6

    Students read charts, surveys, and data summaries and decide whether the conclusions drawn actually hold up. They learn to spot weak samples, misleading graphs, and claims that go further than the data supports.

  • Describe events as subsets of a sample space

    S.CP.1

    A sample space lists every possible outcome of a situation, like all the results of rolling a die. Students sort those outcomes into groups using "or," "and," and "not" to describe which results they care about.

  • Understand that two events A and B are independent if the probability of A and…

    S.CP.2

    Two events are independent when knowing one happened tells you nothing about whether the other did. Students check independence by multiplying the two separate probabilities and seeing if that product matches the probability of both happening at once.

  • Understand the conditional probability of A given B as P

    S.CP.3

    Conditional probability measures how likely one event is once students know another event already happened. Students calculate it by dividing the chance both events happen by the chance the known event happens, and check whether knowing one event changes the odds of the other.

  • Construct and interpret two-way frequency tables of data when two categories…

    S.CP.4

    Students build a table that sorts data by two categories at once, like age and favorite sport, then use the table to figure out whether those two things are related or whether knowing one tells you anything about the other.

  • Recognize and explain the concepts of conditional probability and independence…

    S.CP.5

    Conditional probability asks: does knowing one thing change the odds of another? Students decide whether two real-world events are connected (rain making you late) or truly independent (a coin flip having no memory of the last toss).

  • Find the conditional probability of A given B as the fraction of B's outcomes…

    S.CP.6

    Students figure out how likely event A is when they already know event B happened. They do this by looking at only B's outcomes and counting how many of those also include A.

  • Apply the Addition Rule, P

    S.CP.7

    To find the chance that at least one of two events happens, students add each event's probability, then subtract the overlap so it isn't counted twice. A Venn diagram or two-way table usually shows where that overlap lives.

  • Apply the general Multiplication Rule in a uniform probability model, P

    S.CP.8

    Students calculate the chance that two events both happen by multiplying the probability of the first event by the probability of the second event given the first already occurred. Then they explain what that number means in context.

  • Use permutations and combinations to compute probabilities of compound events…

    S.CP.9

    Students count the number of ways an event can happen using permutations (when order matters) and combinations (when it doesn't), then use those counts to find the probability. Think lottery draws, card hands, or tournament brackets.

  • Define a random variable for a quantity of interest by assigning a numerical…

    S.MD.1

    Students assign a number to each possible outcome of a chance event, then graph how likely each outcome is. The graph looks the same as any data chart they've seen before.

  • Calculate the expected value of a random variable

    S.MD.2

    Students calculate the average outcome you'd expect if a random event (like a dice roll or insurance payout) happened many times. That long-run average is called expected value, and it comes from the probability distribution for that event.

  • Develop a probability distribution for a random variable defined for a sample…

    S.MD.3

    Students build a probability table for every possible outcome of a situation, then calculate the long-run average result. For example, they might find the expected winnings of a game or the expected number of defective parts in a batch.

  • Develop a probability distribution for a random variable defined for a sample…

    S.MD.4

    Students collect real data, assign probabilities based on what actually happened, and build a table showing each possible outcome and how likely it is. Then they calculate the average result you'd expect over many trials.

  • Weigh the possible outcomes of a decision by assigning probabilities to payoff…

    S.MD.5

    Students calculate the average payoff they can expect from a decision by multiplying each possible outcome by its probability and adding the results. This is how insurance companies, investors, and game designers figure out whether a bet is worth taking.

  • Find the expected payoff for a game of chance

    S.MD.5.a

    Students calculate the average payout for a game of chance by weighing each possible result against how likely it is to happen. This tells them whether a game is worth playing or not.

  • Evaluate and compare strategies on the basis of expected values

    S.MD.5.b

    Students calculate the average outcome of two or more strategies to decide which one pays off better over time. This is how insurance companies, game designers, and investors choose between options.

  • Use probabilities to make fair decisions

    S.MD.6

    Students use probability to make decisions that give everyone an equal chance, like drawing names from a hat or using a random number generator to assign groups or prizes.

  • Analyze decisions and strategies using probability concepts

    S.MD.7

    Students use probability to judge whether a decision makes sense, like figuring out if a medical test result is reliable or when a coach should pull the goalie. The math shows whether a choice is worth the risk.

Assessments
The state tests students at this grade and subject take.
National College Readiness

ACT

College-readiness assessment offered statewide to high school students, covering English, mathematics, reading, and science.

When given:
spring
Frequency:
annual
Official source
Common Questions
  • What does math look like this year?

    Students work with the kind of math that shows up in college and on the job: functions, graphs, triangles, probability, and a first look at complex numbers and vectors. A lot of the year is about taking real situations and turning them into equations or graphs that answer a question.

  • How can someone help at home when a problem looks complicated?

    Ask the student to read the problem out loud and say what the question is actually asking. Then ask what they already know and what they need to find. Most stuck moments come from skipping that first step, not from missing math skills.

  • Is a graphing calculator or computer needed?

    Yes. A graphing calculator or a free tool like Desmos is used regularly to graph functions, fit data, and solve equations that are messy by hand. Knowing how to use one well is part of the work this year.

  • What should be solid by the end of the year for the next math class?

    Students should be comfortable solving and graphing different kinds of functions (linear, quadratic, exponential, logarithmic, and basic trig), working with right and non-right triangles, and reading probability and statistics in context. These are the tools the next course assumes.

  • How should the year be sequenced?

    A common path is to start with algebra review and functions, move into polynomials and rational expressions, then exponentials and logarithms, then trigonometry and the unit circle, and close with probability and statistics. Geometry topics like circles and conics fit naturally alongside the function work.

  • Which topics usually need the most reteaching?

    Rational exponents and logarithms, completing the square, and the unit circle tend to need a second pass. Probability ideas like conditional probability and independence also catch a lot of students off guard, especially in word problems.

  • What is a good way to practice trigonometry at home?

    Ask the student to sketch the unit circle from memory and label the angles in degrees and radians. Five minutes a few times a week builds the recall that makes the rest of trig much easier.

  • How much should be spent on modeling versus pure skill practice?

    Aim for roughly half and half. Skill practice keeps procedures sharp, but modeling problems (fitting a function to data, setting up a system, interpreting a graph) are where the standards live and where most students grow the most.

  • What is the difference between correlation and causation, and why does it keep coming up?

    Correlation means two things move together in the data. Causation means one actually drives the other. Students are expected to spot the difference because news stories, ads, and studies often blur it, and the math gives a way to push back.