Skip to content

What does a student learn in ?

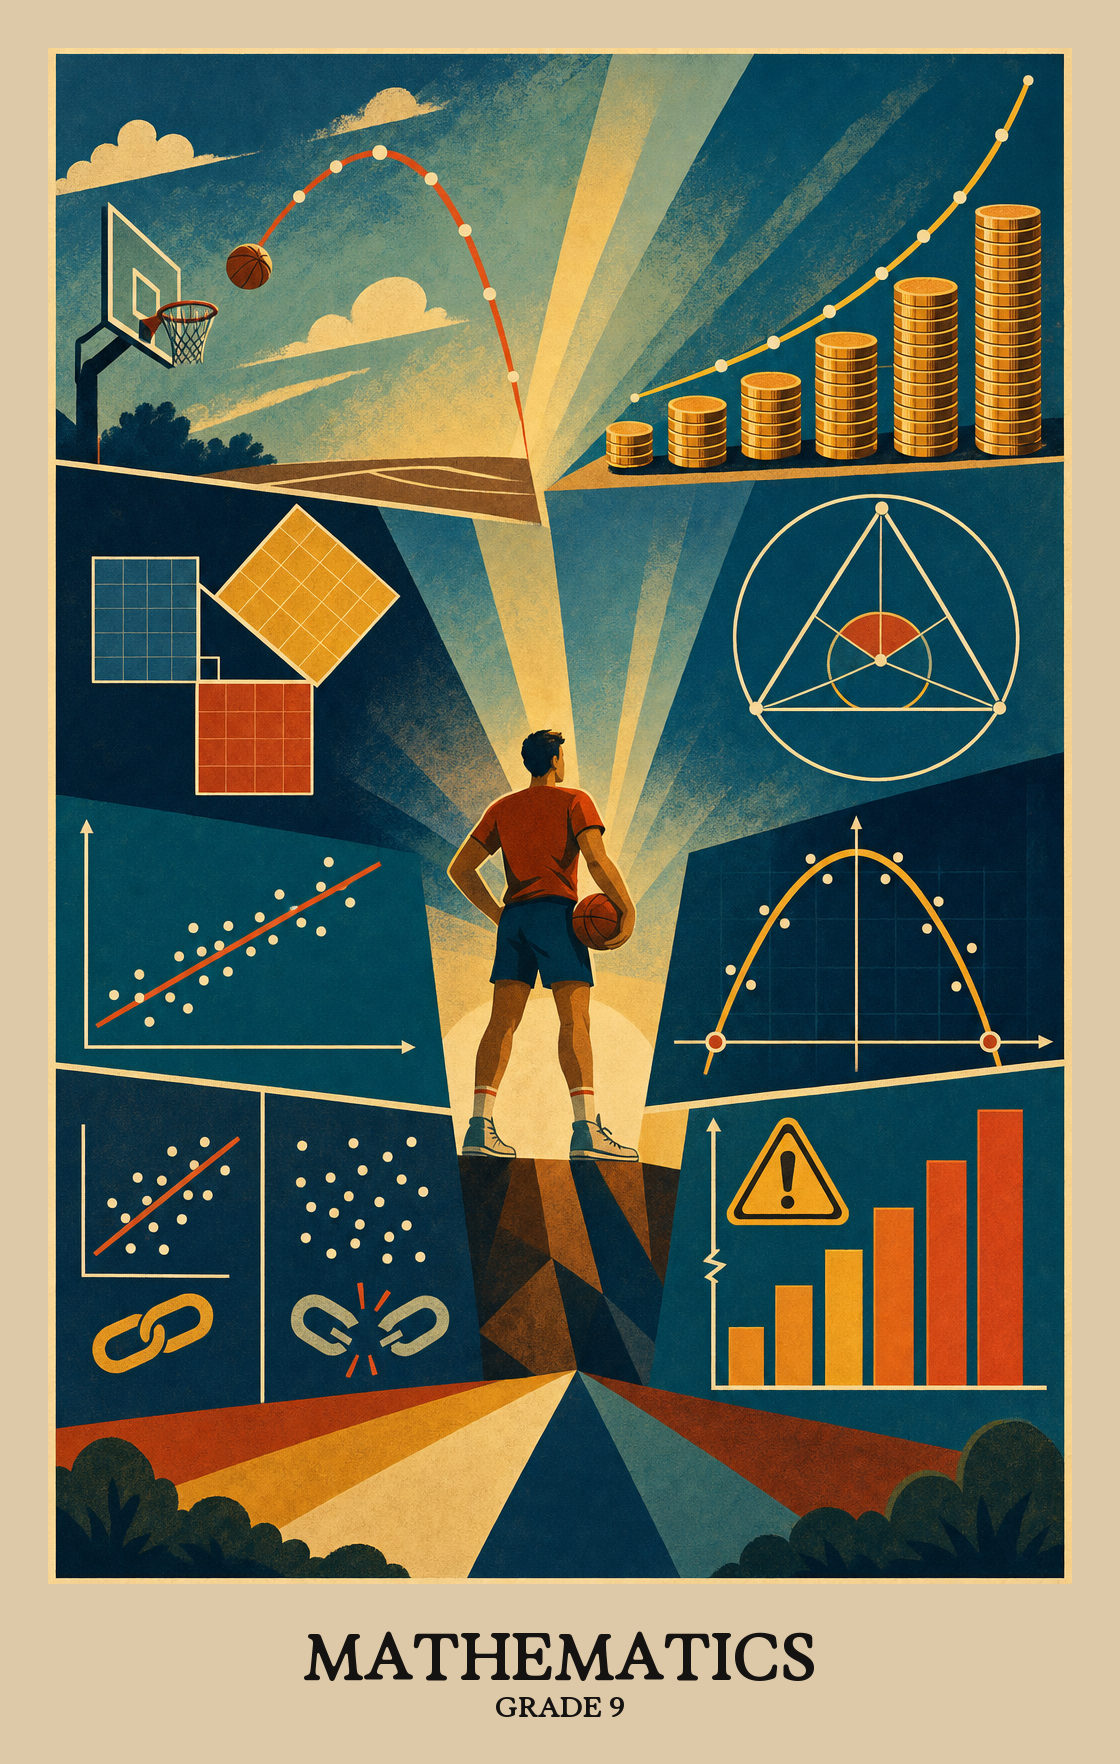
This is the year math shifts from solving problems to building and defending arguments. Students model real situations with quadratic and exponential functions, then check whether the answer actually makes sense. In geometry, they prove why shapes behave the way they do using triangles, circles, and the Pythagorean theorem. Students also read data the way a careful adult does, spotting bias and the difference between correlation and cause. By spring, students can fit a line or curve to real data, solve a quadratic equation, and explain whether a claim in a news graph holds up.

Illustration of what students learn in Grade 9 Mathematics
  • Quadratic functions
  • Data and statistics
  • Right triangles
  • Geometric proof
  • Exponential growth
  • Financial math
  • Systems of equations
Source: Minnesota Minnesota Academic Standards
Year at a glance
How the year usually goes. Every school and district set their own curriculum, so treat this as a guide, not official pacing.
  1. 1

    Working with numbers and expressions

    Students start the year sharpening the algebra skills they will lean on all year. They work with very large and very small numbers, rewrite expressions in different forms, and check that their answers actually make sense.

  2. 2

    Quadratics and polynomials

    Students learn to add, subtract, and multiply polynomials, then move into quadratic equations. They factor, complete the square, and use the quadratic formula to solve problems and graph parabolas.

  3. 3

    Functions and systems

    Students compare different kinds of functions and how their graphs shift and stretch. They solve systems of equations and inequalities, including ones that show up in loan payments, savings, and other money decisions.

  4. 4

    Geometry and trigonometry

    Students prove why shapes behave the way they do and use those rules to find missing lengths and angles. They apply the Pythagorean Theorem, work with similar and congruent triangles, and use trigonometric ratios in right triangles.

  5. 5

    Area, volume, and circles

    Students figure out surface area and volume for three-dimensional shapes and apply those formulas to real costs like painting a room or filling a container. They also explore the angles and lines that show up inside and around circles.

  6. 6

    Data, statistics, and modeling

    Students ask questions about data and decide how to collect and display it honestly. They fit linear and exponential models to real numbers, judge how well a model fits, and spot when a chart or claim is misleading.

Mastery Learning Standards
The required skills a student should display by the end of Grade 9.
Data Analysis
  • Formulate statistical investigative questions and pose hypotheses

    9.1.1.1

    Students write a question worth investigating, then predict what the data might show before collecting any numbers. The question usually asks about differences between groups or how two things relate to each other.

  • Explain how choices concerning data collection methods can affect the quality…

    9.1.1.2

    Students learn how the way data is gathered changes what you get: a survey of 10 people costs less but misses more than a survey of 1,000, and an online poll leaves out anyone without internet access.

  • Analyze issues of bias by considering data collection methods and cultural…

    9.1.1.3

    Students examine how the way data is collected can skew results, and how cultural background or perspective can shape what gets counted, asked, or left out.

  • Explain the purposes of and differences among sample surveys, experiments and…

    9.1.1.4

    Students learn why researchers use different methods to gather data and what each method can actually prove. A survey asks questions, an experiment tests a cause, and an observation watches without interfering. Only a randomized experiment can show that one thing caused another.

  • Analyze and explain when arguments based on data confuse correlation and…

    9.1.1.5

    Students learn why two things happening together does not mean one causes the other. They practice spotting flawed arguments that treat a pattern in data as proof of cause.

  • Compute using technology or estimate the correlation coefficient of a linear…

    9.1.1.6

    Students use a calculator or software to find the correlation coefficient, a number that shows how closely two things are related on a scatter plot. They then explain what that number means for the real-world situation the data describes.

  • Use the mean and standard deviation of a data set to fit it to a normal…

    9.1.1.7

    Students learn when it is fair to use a bell curve to describe a data set, then use the average and spread of the numbers to estimate what percentage of a population falls in a given range.

  • Use data from a random sample to draw inferences about a population with an…

    9.1.1.8

    Students pick a small random group to make predictions about a larger population, then repeat the process several times to see how much their estimates shift from sample to sample.

  • Use statistics appropriate to the shape of the data distribution to compare the…

    9.1.1.9

    Students compare two or more data sets by choosing the right summary numbers, like the average or median, based on how the data is shaped. They look at both the center and the spread to draw honest conclusions.

  • Create and analyze data displays, including scatter plots, histograms and…

    9.1.1.10

    Students use a computer or calculator to build scatter plots, histograms, and box plots, then explain what the data shows. The focus is on reading the shape of the data and drawing conclusions from it.

  • Identify, create and compare statistical models with linear and exponential…

    9.1.1.11

    Students plot real data on a graph, then find the line or curve that best fits the pattern. They check how well the model works by measuring how far off each predicted value is from the actual data.

  • Examine and discuss competing explanations for data trends observed such as…

    9.1.1.12

    Students look at a set of data, consider reasons the trend might be misleading (such as a hidden variable), and decide which conclusions the numbers actually support versus which ones are a stretch.

  • Analyze and interpret data using various measures, such as difference in…

    9.1.1.13

    Students read a set of data to spot patterns, describe where most values cluster, and notice any numbers that sit far outside the rest. Then they use what they see to draw conclusions.

  • Evaluate reports based on published data by identifying the source of the data…

    9.1.1.14

    Students read real published reports and ask hard questions about them: Who collected this data, how was the study set up, and does the graph actually show what the headline claims?

  • Identify and explain misleading uses of data along with how to use…

    9.1.1.15

    Students learn to spot when a chart or table makes data look different than it really is, then use spreadsheet or graphing tools to check what the numbers actually show. They also practice choosing how to display data to support a specific argument.

Spatial Reasoning
  • Apply the Pythagorean Theorem and distance formula to compute perimeters of…

    9.2.3.1

    Students use the Pythagorean theorem to find side lengths of triangles and rectangles plotted on a coordinate grid, then calculate the perimeter or area of those shapes.

  • Apply properties of 45°-45°-90° and 30°-60°-90° triangles to solve situations…

    9.2.3.2

    Students use the side-length shortcuts in two special right triangles to find missing measurements. If you know one side of a 45-45-90 or 30-60-90 triangle, you can figure out the rest without a ruler.

  • Use trigonometric ratios and the Pythagorean Theorem and its converse to solve…

    9.2.3.3

    Students use sine, cosine, tangent, and the Pythagorean Theorem to find missing side lengths and angles in real-world problems involving right triangles, such as calculating the height of a building or the length of a ramp.

  • Develop, justify and use decomposition to determine the formula for surface…

    9.2.3.4

    Students break apart 3D shapes like prisms and pyramids into simpler pieces, then figure out why the surface area and volume formulas work, not just how to use them.

  • Use the formulas for surface area and volume of various three-dimensional…

    9.2.3.5

    Students apply surface area and volume formulas to real-world problems involving 3D shapes like cylinders, cones, and prisms. Problems typically take more than one step to solve.

  • Use units of measure and dimensional analysis to solve multi-step situations

    9.2.3.6

    Students convert between units, plug the right units into formulas, and read scales and starting points on graphs to solve problems that take more than one step.

  • Compute the unit cost and total cost to cover different areas and volumes in…

    9.2.3.7

    Students figure out how much it costs to cover or fill a space, like how much paint to buy for a wall or mulch for a garden, then find the most affordable option. They use spreadsheets to test different scenarios.

  • Use similarity to determine the side ratios in right triangles as properties of…

    9.2.3.8

    Students use the angles inside a right triangle to find the ratios between its sides, then connect those ratios to sine, cosine, and tangent. The angle determines the ratio, no matter how big or small the triangle is.

  • Apply dilations of scale factor k on length, area and volume and recognize the…

    9.2.3.9

    When a shape is scaled up or down by a factor, its lengths multiply by that factor, its area multiplies by the factor squared, and its volume multiplies by the factor cubed. Students practice applying those rules to solve measurement problems.

  • Apply properties of angles, including corresponding, exterior, interior…

    9.2.4.1

    When two lines cross or a line cuts through parallel lines, students use the angle relationships formed to find missing angle measures and explain why their answer is correct.

  • Apply properties of equilateral, isosceles and scalene triangles to solve…

    9.2.4.2

    Students use the special rules of triangles with equal sides, two equal sides, or no equal sides to solve problems and explain their reasoning in writing.

  • Apply properties such as interior and exterior angles and parallel and…

    9.2.4.3

    Students classify shapes like triangles, pentagons, and hexagons by measuring their angles and checking which sides are parallel or perpendicular, then use those properties to solve problems.

  • Apply properties of congruent figures to solve situations and logically justify…

    9.2.4.4

    Two shapes are congruent when they match exactly in size and angles. Students use that relationship to find missing measurements and explain why their answer is correct.

  • Accurately interpret and use words and phrases such as “if

    9.2.4.5

    Students learn to read logic phrases like "if ... then" and "if and only if" precisely, then work out how flipping or negating those phrases changes the meaning, and whether the new statement is still true.

  • Analyze the validity of a logical argument and give counterexamples to disprove…

    9.2.4.6

    Students read a geometric argument and decide if the logic actually holds up. If it doesn't, they find a specific example that proves it wrong.

  • Construct logical arguments using axioms, definitions, theorems and postulates…

    9.2.4.7

    Students build step-by-step proofs that explain why a geometric rule is true, using accepted math facts and definitions as their evidence.

  • Identify, describe and solve using relationships among inscribed angles…

    9.2.4.8

    Students use angle measurements and line segments inside and around a circle to solve geometry problems. They work with angles formed where lines touch or cross a circle and explain how those angles and distances relate to each other.

  • Describe and solve using the relationships of angles formed outside the circle…

    9.2.4.9

    When two lines cross outside a circle, they create angles with a measurable relationship to the arcs they cut. Students find those angles using the arcs of the circle the lines pass through or touch.

  • Apply properties of similar figures to solve situations and logically justify…

    9.2.4.10

    Students use the rules of similar figures (same shape, scaled size) to solve problems and explain why their answer makes sense, not just state it.

  • Show that two triangles are similar using the AA, SAS and SSS similarity…

    9.2.4.11

    Students prove two triangles are similar by comparing their angles and sides using three methods: matching two angles, two proportional sides with the angle between them, or all three proportional sides.

  • Make geometric constructions with a variety of tools, including dynamic…

    9.2.4.12

    Students use rulers, compasses, or geometry software to draw shapes and test whether geometric rules actually hold up. The goal is building the reasoning to explain why a construction works, not just whether it looks right.

  • Create and compare rigid and non-rigid transformations

    9.2.4.13

    Students move, flip, and rotate shapes (rigid transformations) or stretch and distort them (non-rigid), then compare the original shape to the result to decide whether the two shapes are still congruent.

  • Describe the steps used to show various sequences of transformations, applying…

    9.2.4.14

    Students explain the step-by-step moves, flipping, spinning, sliding, or resizing a shape, that turn one figure into an exact match of another.

  • Apply geometric methods to solve design situations, including designing an…

    9.2.4.15

    Students use geometry to solve real design problems, like figuring out the best dimensions for a structure or making the most of limited space or materials.

  • Apply concepts of density based on area and volume in modeling contextual…

    9.2.4.16

    Students figure out how much of something is packed into a given space, like how many people live per square mile or how much heat a room holds per cubic foot. They use those rates to solve real problems.

Patterns and Relationships
  • Add, subtract, multiply and divide numbers in scientific notation

    9.3.5.1

    Students calculate with very large or very small numbers written in scientific notation, such as the distance between planets or the size of a cell, using all four operations.

  • Compare the definition of rational exponents and properties of radicals

    9.3.5.2

    Students connect fraction exponents to radical symbols, showing that writing a power like x^(1/2) is another way to express a square root. They extend the rules for whole-number exponents to make sense of why that notation works.

  • Apply knowledge of number systems extending from whole numbers to integers…

    9.3.5.3

    Students learn how numbers expand in layers, from whole numbers out to negatives, fractions, and beyond, then use that bigger picture to solve equations that simpler number systems can't handle.

  • Use matrices to represent and manipulate data and interpret the results in…

    9.3.5.4

    Students use grids of numbers called matrices to organize real data, then add, subtract, or multiply those grids to find answers. Reading the results means explaining what the numbers actually mean in the original situation.

  • Estimate and verify the cost of an item, including multiple discounts and taxes

    9.3.5.5

    Students figure out the real price of an item after layering in discounts and taxes, doing the math in the right order so the answer comes out correct.

  • Assess the reasonableness of a solution in its given context, including…

    9.3.5.6

    Students check whether an answer actually makes sense for the situation, comparing it to a rough estimate or graph. If the numbers are about money or a real-world problem, they explain what the answer means in plain terms.

  • Use the structure of an expression, equation and/or formula to create an…

    9.3.5.7

    Students rewrite a formula to solve for the variable they actually need. For example, rearranging the area formula to find width instead of area uses the same steps as solving any equation.

  • Use the structure of an expression to write it in multiple ways

    9.3.5.8

    Students rewrite the same math expression in different forms to show they mean the same thing, like seeing that 2(x + 3) and 2x + 6 are identical. Spotting that structure helps solve problems faster.

  • Find and evaluate the composition of multiple functions

    9.3.5.9

    Students take the output of one function and feed it directly into another, chaining them together. They then calculate and interpret what the combined process actually does to a starting value.

  • Compute the time it takes to pay off a loan given the interest rate, loan…

    9.3.5.10

    Students figure out how long it takes to pay off a loan and how much it actually costs. They compare what happens when the loan amount, interest rate, or monthly payment changes, using a spreadsheet to run the numbers.

  • Compute the total payments to pay off a loan given the interest rate, loan…

    9.3.5.11

    Students figure out how much a loan actually costs by calculating total payments over time. They compare how changing the monthly payment or interest rate affects the final amount paid.

  • Compare different types of retirement plans, considering after tax or pretax…

    9.3.5.12

    Students compare retirement savings options, looking at how taxes, employer matches, and the age you start saving all affect how much money you end up with.

  • Add, subtract and multiply polynomials

    9.3.6.1

    Students combine and simplify polynomial expressions by adding, subtracting, and multiplying terms. This is the algebra behind expanding brackets and collecting like terms.

  • Reason abstractly to compare general forms of quadratics, including vertex…

    9.3.6.2

    Students learn that a quadratic equation can be written three different ways, each one useful for a different purpose. They practice converting between forms and connecting each written version to the shape of its graph.

  • Choose and produce an equivalent form of a quadratic function, using symbolic…

    9.3.6.3

    Students rewrite a quadratic function in different forms to find where its parabola peaks or dips, where it crosses the axes, and where it folds in half.

  • Factor common monomial factors from polynomials, quadratic polynomials and the…

    9.3.6.4

    Students learn to break apart expressions like x² - 9 or 3x² + 6x by pulling out shared factors. This is the reverse of multiplying, and it makes equations much easier to solve.

  • Solve quadratic equations by appropriate methods using factoring, completing…

    9.3.6.5

    Students solve quadratic equations (equations with an x-squared term) using methods like factoring or the quadratic formula. When no real solution exists, they find complex number answers involving the square root of a negative number.

  • Compare the equation of a circle, the Pythagorean Theorem and the Distance…

    9.3.6.6

    Students learn that the equation of a circle, the Pythagorean Theorem, and the Distance Formula all express the same geometric idea. They rewrite a circle's equation by completing the square to find its center point and radius.

  • Solve situations involving relationships which are inversely proportional in…

    9.3.6.7

    Students solve real problems where two quantities work in opposite directions: as one goes up, the other comes down. Think of speed and travel time, or workers and hours needed to finish a job.

  • Apply the properties of rational exponents and radicals to generate equivalent…

    9.3.6.8

    Students rewrite expressions with roots and fractional exponents into equivalent forms by applying exponent rules. For example, they convert between radical notation and expressions like x to the one-half power.

  • Represent and solve situations in various contexts, including financial…

    9.3.7.1

    Students set up and solve real-world problems, including money situations, using pairs of equations, shaded-boundary graphs, and curved growth patterns to find answers that satisfy multiple conditions at once.

  • Translate between graphs of quadratic, exponential and other functions

    9.3.7.2

    Given a function as a table, equation, or graph, students convert it into one of the other two forms. They also sketch curves by hand and use graphing tools to check their work.

  • Determine how vertical/ horizontal reflecting, translating and scaling affect…

    9.3.7.3

    Students learn how stretching, flipping, or sliding a graph changes the equation behind it. They use graphing tools to see how each move reshapes the curve on screen.

  • Express the terms in an arithmetic or geometric sequence recursively and by…

    9.3.7.4

    Students write two types of formulas for number sequences: one that finds any term directly and one that builds each term from the one before it.

  • Express recursive patterns using recursive formulas

    9.3.7.5

    A recursive formula defines each term using the term before it. Students write these formulas and use them to calculate the next numbers in a sequence, like finding each new value by doubling or adding a fixed amount to the last one.

  • Find the domain and range of functions defined symbolically, graphically or in…

    9.3.7.6

    Students find the set of valid inputs and outputs for a function shown as an equation, a graph, or a real-world situation. They also check whether an answer makes sense in context, since not every mathematically correct value works in practice.

  • Describe the graph of a function using key features such as intercepts…

    9.3.7.7

    Students read a graph to spot where a line crosses the axes, where it peaks or bottoms out, and whether it climbs or falls across different sections. From those details, they draw conclusions about what the graph shows.

  • Define the compounding of interest n times per year according to a recursive…

    9.3.7.8

    Students learn how compound interest works: money grows faster when a bank adds interest more often. They connect the compound interest formula to exponential growth patterns and explain what each part of the formula means.

  • Find the inverse of a given function and justify the results using tables…

    9.3.7.9

    Students find the reverse of a function, working backward to undo what the original function does. They check their answer using a table, a graph, or algebra.

  • Use the concept of a function as a connection between inputs and outputs to…

    9.3.7.10

    Students learn what a function is: a rule where each input gives exactly one output. They practice plugging numbers into that rule and writing the result using standard function notation like f(x).

No state assessments at this grade
Students take their next one in Grade 10.
Alternate assessment

MTAS / Alternate MCA

Alternate standards-based assessment for eligible students with the most significant cognitive disabilities, administered in the same subjects and grades as the MCA program.

When given:
spring
Frequency:
annual
Official source
Common Questions
  • What does math look like this year?

    Students work across four big areas: data and statistics, geometry and measurement, algebra with quadratics and exponents, and money math like loans and interest. The year leans heavily on reasoning, modeling real situations, and using technology like spreadsheets and graphing tools.

  • How can I help at home if my child gets stuck on a math problem?

    Ask students to explain what the problem is asking and what they already tried. Sketching a picture, plugging in a simple number, or rereading the question out loud usually unsticks more than another worked example. Five minutes of talking it through beats hovering over the answer.

  • Does my child still need to memorize anything, or can they just use a calculator?

    Calculators handle the arithmetic, but students still need quick recall of basic facts, square roots, and exponent rules so they can spot when an answer looks wrong. Estimation matters more than ever this year because so much work involves checking whether a calculator result makes sense.

  • How should the year be sequenced?

    A common order is linear and exponential review, then quadratics and polynomial work, then right triangle geometry and trigonometry, then circles and similarity, with statistics and financial literacy threaded throughout. Putting data analysis near a quadratic or exponential unit lets regression and model fit reinforce each other.

  • Which topics usually need the most reteaching?

    Factoring, completing the square, and moving between forms of a quadratic tend to take the longest to stick. Right triangle trigonometry and interpreting function notation are close behind. Building in spiraled practice across units helps more than one long review at the end.

  • What is one real-world topic worth pulling parents into?

    The loan and interest standards are a strong bridge to home. A short project where students compare car loans or credit card payoff times on a spreadsheet often sparks dinner table conversations and makes the algebra feel useful.

  • How do I know if my child is ready for the next math course?

    By spring, students should be able to solve a quadratic equation more than one way, set up a right triangle problem using sine, cosine, or tangent, and read a scatterplot well enough to judge whether a line fits. If those feel shaky, ask the teacher which one to firm up first.

  • What does mastery look like by the end of the year?

    Students can model a situation with the right type of function, solve it, and explain whether the answer makes sense in context. They can also justify a geometry result with a clear argument and interpret a statistical claim without confusing correlation with causation.