Equations, inequalities, and structure
Students start by writing and solving equations and inequalities that describe real situations. They learn to read an expression closely and explain what each part of it means in context.
This is the year math stops being one subject and splits into algebra and geometry working side by side. Students model situations with equations, including quadratics and exponentials, and they graph functions to see how a change in the rule changes the picture. In geometry, they prove why shapes are congruent and use right-triangle trig to find missing sides and angles. By spring, students can solve a quadratic equation, sketch its graph, and find a missing side of a right triangle using sine, cosine, or the Pythagorean theorem.
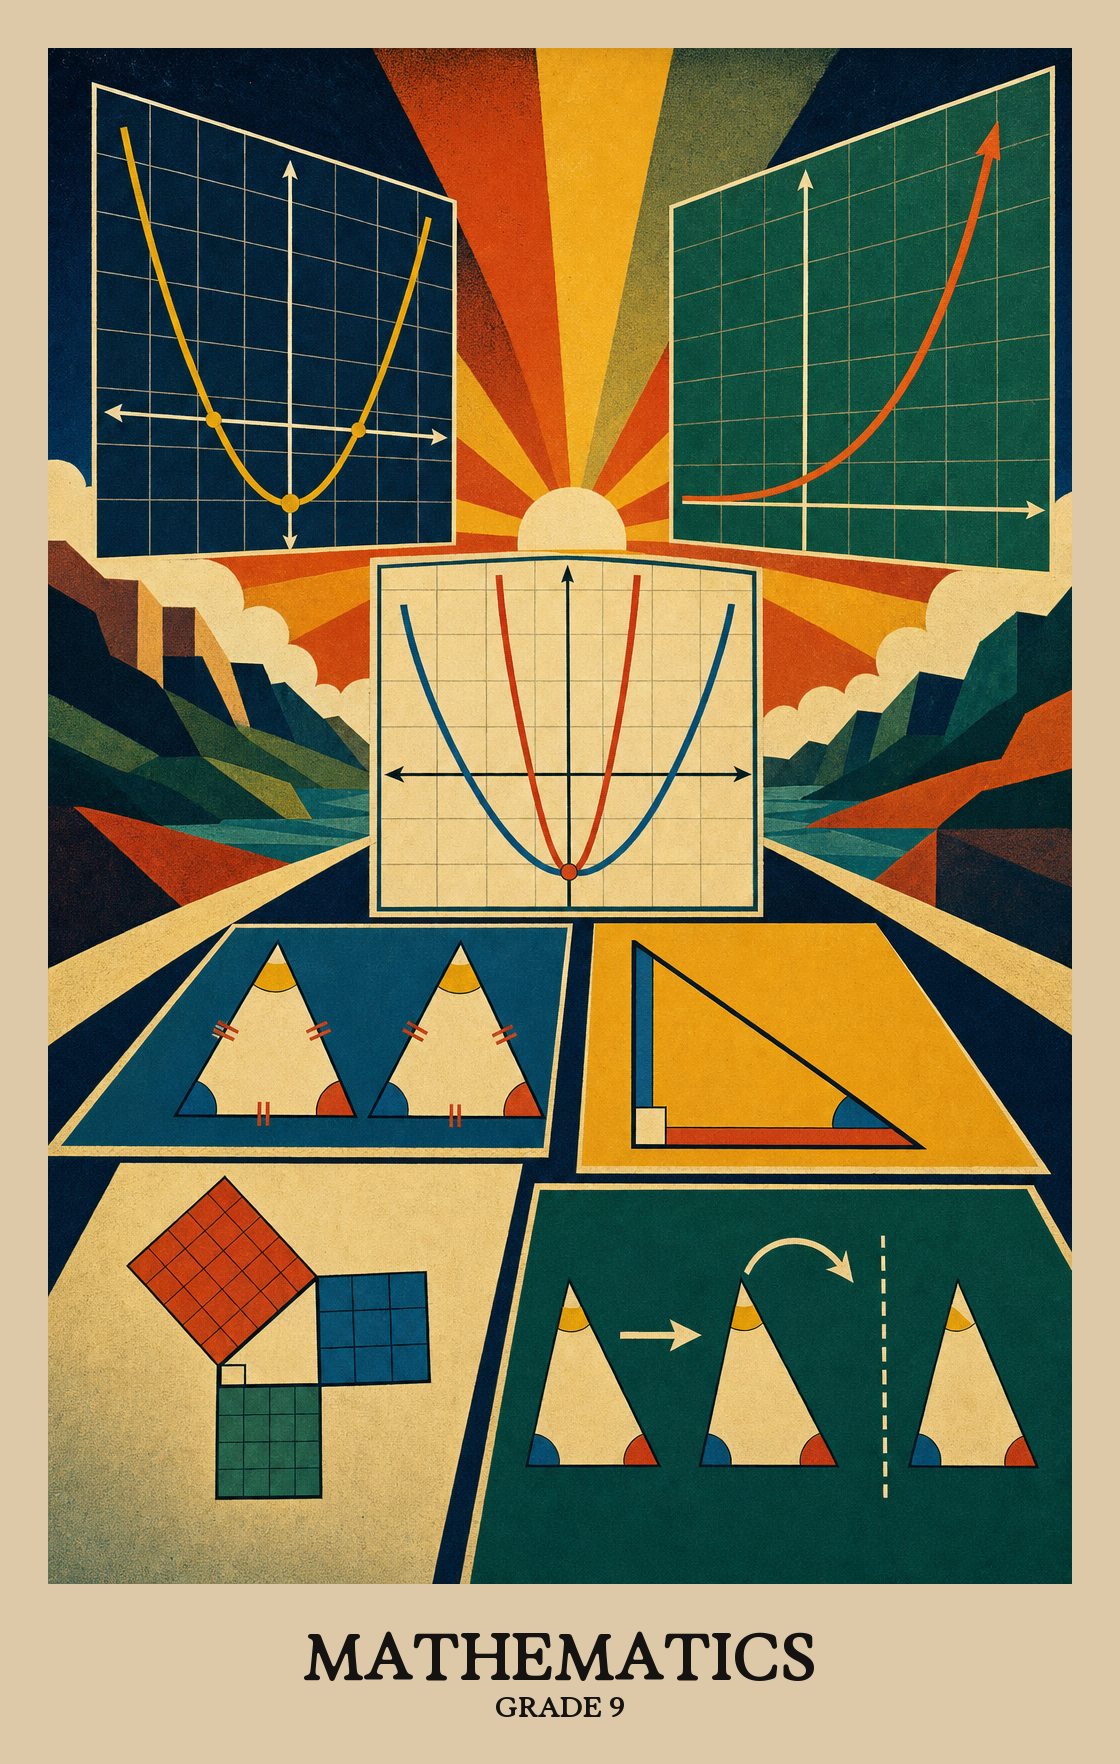
Students start by writing and solving equations and inequalities that describe real situations. They learn to read an expression closely and explain what each part of it means in context.
Students work with linear, quadratic, and exponential functions using tables, graphs, and formulas. They learn to spot key features on a graph, such as where it crosses zero or where it peaks.
Students build functions that match real data, including patterns that grow at a steady rate and patterns that double or shrink quickly. They also write number sequences with rules that predict the next term.
Students slide, flip, and rotate shapes to show when two figures match exactly. They prove facts about triangles and polygons and use coordinates to back up geometric claims.
Students use the Pythagorean theorem and basic trigonometry to find missing sides and angles. They also calculate volume for cylinders, cones, spheres, and combined shapes in design problems.
Students summarize data with graphs and statistics, then judge whether a model fits the numbers. They study the normal curve, margin of error in samples, and what it means for two events to be independent.
Students learn how shapes move, flip, and rotate on a flat surface without changing size. They practice sliding, reflecting, and turning figures to see how position changes while the shape stays the same.
Students move a shape by rotating, flipping, or sliding it, then figure out which combination of those moves turns one shape into a matching one.
Rigid motions are slides, flips, and turns that move a shape without changing its size or angles. Students use these moves to show that two shapes are congruent, meaning one maps exactly onto the other.
Two shapes are congruent if one can be moved onto the other by sliding, flipping, or rotating, with no stretching or shrinking. Students use that idea to build a precise definition of what "same shape, same size" actually means in geometry.
Students write formal proofs to show why geometric rules always hold, such as why opposite angles are equal or why the angles of a triangle add up to 180 degrees.
Students prove why rules about polygons are always true, such as why the interior angles of a triangle add up to 180 degrees. They build logical arguments from basic geometric facts rather than just accepting the rules.
Students use a compass and straightedge to draw precise geometric shapes, like copying an angle or bisecting a line segment, without measuring tools.
Students practice drawing precise shapes, angles, and lines using a compass and straightedge. The focus is on following exact steps to build figures accurately, not just sketching by hand.
| Standard | Definition | Code |
|---|---|---|
| Experiment with transformations in the plane | Students learn how shapes move, flip, and rotate on a flat surface without changing size. They practice sliding, reflecting, and turning figures to see how position changes while the shape stays the same. | G.CO.A |
| Demonstrate the ability to rotate, reflect or translate a figure | Students move a shape by rotating, flipping, or sliding it, then figure out which combination of those moves turns one shape into a matching one. | G.CO.A.5 |
| Understand congruence in terms of rigid motions | Rigid motions are slides, flips, and turns that move a shape without changing its size or angles. Students use these moves to show that two shapes are congruent, meaning one maps exactly onto the other. | G.CO.B |
| Develop the definition of congruence in terms of rigid motions | Two shapes are congruent if one can be moved onto the other by sliding, flipping, or rotating, with no stretching or shrinking. Students use that idea to build a precise definition of what "same shape, same size" actually means in geometry. | G.CO.B.6 |
| Prove geometric theorems | Students write formal proofs to show why geometric rules always hold, such as why opposite angles are equal or why the angles of a triangle add up to 180 degrees. | G.CO.C |
| Prove theorems about polygons | Students prove why rules about polygons are always true, such as why the interior angles of a triangle add up to 180 degrees. They build logical arguments from basic geometric facts rather than just accepting the rules. | G.CO.C.10 |
| Make geometric constructions | Students use a compass and straightedge to draw precise geometric shapes, like copying an angle or bisecting a line segment, without measuring tools. | G.CO.D |
| Construct geometric figures using various tools and methods | Students practice drawing precise shapes, angles, and lines using a compass and straightedge. The focus is on following exact steps to build figures accurately, not just sketching by hand. | G.CO.D.11 |
Students work with imaginary numbers, the kind that show up when you take the square root of a negative number. They learn to add, subtract, and multiply these numbers the same way they handle ordinary algebra.
The Fundamental Theorem of Algebra states that every polynomial equation has at least one complex-number solution. Students use this to figure out exactly how many solutions a polynomial can have based on its highest exponent.
| Standard | Definition | Code |
|---|---|---|
| Use complex numbers | Students work with imaginary numbers, the kind that show up when you take the square root of a negative number. They learn to add, subtract, and multiply these numbers the same way they handle ordinary algebra. | A2.NQ.B |
| Know and apply the Fundamental Theorem of Algebra | The Fundamental Theorem of Algebra states that every polynomial equation has at least one complex-number solution. Students use this to figure out exactly how many solutions a polynomial can have based on its highest exponent. | A2.NQ.B.7 |
Students read an algebraic expression and explain what each part means in context. For example, they identify whether a term represents a starting value, a rate, or a repeated factor before deciding how to use the expression.
Students read a formula or expression and explain what each part means in real life. If a term represents monthly rent or a growth rate, students say so in plain language.
Students look at a polynomial expression and rewrite it in a different but equal form, such as factoring or expanding, to make it easier to solve or use.
Students learn what a logarithm is and how to use it. A logarithm answers the question "what power do I raise this number to in order to get that result?" so students can work backward from a calculated value to find the missing exponent.
Logarithmic scales compress huge ranges of numbers, like earthquake strength or sound volume, into something readable on a graph. Students learn why scientists use those scales and how to solve problems with them.
| Standard | Definition | Code |
|---|---|---|
| Interpret and use structure | Students read an algebraic expression and explain what each part means in context. For example, they identify whether a term represents a starting value, a rate, or a repeated factor before deciding how to use the expression. | A1.SSE.A |
| Interpret the contextual meaning of individual terms or factors from a given… | Students read a formula or expression and explain what each part means in real life. If a term represents monthly rent or a growth rate, students say so in plain language. | A1.SSE.A.1 |
| Analyze the structure of polynomials to create equivalent expressions or… | Students look at a polynomial expression and rewrite it in a different but equal form, such as factoring or expanding, to make it easier to solve or use. | A1.SSE.A.2 |
| Define and use logarithms | Students learn what a logarithm is and how to use it. A logarithm answers the question "what power do I raise this number to in order to get that result?" so students can work backward from a calculated value to find the missing exponent. | A2.SSE.A |
| Understand why logarithmic scales are used | Logarithmic scales compress huge ranges of numbers, like earthquake strength or sound volume, into something readable on a graph. Students learn why scientists use those scales and how to solve problems with them. | A2.SSE.A.4 |
Students write equations to describe patterns that grow in a straight line, curve like a parabola, or double (or halve) over time. The equations can model real situations like cost, distance, or population growth.
Students write an equation or inequality with one unknown, then use it to answer a question like "how many hours until the tank is empty?" or "what price keeps the total under budget?"
| Standard | Definition | Code |
|---|---|---|
| Create equations that describe linear, quadratic and exponential relationships | Students write equations to describe patterns that grow in a straight line, curve like a parabola, or double (or halve) over time. The equations can model real situations like cost, distance, or population growth. | A1.CED.A |
| Create equations and inequalities in one variable and use them to model and/or… | Students write an equation or inequality with one unknown, then use it to answer a question like "how many hours until the tank is empty?" or "what price keeps the total under budget?" | A1.CED.A.1 |
Students solve equations and inequalities using algebraic methods, choosing the right approach for each problem. This includes linear, quadratic, and rational equations, as well as compound inequalities.
Students write and solve equations and inequalities from real situations, including ones where a value can be a set distance from zero in either direction on a number line.
Students solve two or more equations or inequalities at the same time, finding the values that make all of them true at once. This covers any combination of linear, quadratic, or other equation types.
Students write and solve problems that mix different types of equations, including curves and lines, to find where they intersect or satisfy a set of conditions.
| Standard | Definition | Code |
|---|---|---|
| Solve equations and inequalities | Students solve equations and inequalities using algebraic methods, choosing the right approach for each problem. This includes linear, quadratic, and rational equations, as well as compound inequalities. | A2.REI.A |
| Create and solve equations and inequalities, including those that involve… | Students write and solve equations and inequalities from real situations, including ones where a value can be a set distance from zero in either direction on a number line. | A2.REI.A.1 |
| Solve general systems of equations and inequalities | Students solve two or more equations or inequalities at the same time, finding the values that make all of them true at once. This covers any combination of linear, quadratic, or other equation types. | A2.REI.B |
| Create and solve systems of equations that may include non-linear equations… | Students write and solve problems that mix different types of equations, including curves and lines, to find where they intersect or satisfy a set of conditions. | A2.REI.B.3 |
Solving an equation means finding the value that makes both sides balance. Students work through one-variable equations and inequalities step by step, keeping track of what each move does to both sides.
Students compare methods for solving quadratic equations, such as factoring, completing the square, and the quadratic formula, and explain when one approach is easier than another.
Students graph linear and exponential equations and inequalities on a coordinate plane, then use those graphs to find solutions.
Every point on a graphed line is a solution to that equation. Students learn to see the graph as a picture of every (x, y) pair that makes the equation true.
Students find all the values that satisfy two or more inequality rules at once, then shade the overlapping region on a graph to show every solution that works.
| Standard | Definition | Code |
|---|---|---|
| Understand solving equations as a process | Solving an equation means finding the value that makes both sides balance. Students work through one-variable equations and inequalities step by step, keeping track of what each move does to both sides. | A1.REI.A |
| Analyze different methods of solving quadratic equations | Students compare methods for solving quadratic equations, such as factoring, completing the square, and the quadratic formula, and explain when one approach is easier than another. | A1.REI.A.2c |
| Represent and solve linear and exponential equations and… | Students graph linear and exponential equations and inequalities on a coordinate plane, then use those graphs to find solutions. | A1.REI.C |
| Explain that the graph of an equation in two variables is the set of all its… | Every point on a graphed line is a solution to that equation. Students learn to see the graph as a picture of every (x, y) pair that makes the equation true. | A1.REI.C.6 |
| Solve problems involving a system of linear inequalities | Students find all the values that satisfy two or more inequality rules at once, then shade the overlapping region on a graph to show every solution that works. | A1.REI.C.8 |
Students prove that two shapes are similar by showing their angles match and their sides scale by the same factor. This includes formal proofs about triangles, parallel lines, and proportional relationships.
Triangles that are the same shape or an exact copy of each other follow rules that let students solve for missing sides and angles, then use those same rules to explain why two shapes must be related in a certain way.
Students learn what sine, cosine, and tangent mean as ratios of sides in a right triangle, then use those ratios to find missing side lengths and angles.
Given two pieces of information about a right triangle (like an angle and one side), students find all the missing side lengths and angles using sine, cosine, tangent, and the Pythagorean Theorem.
| Standard | Definition | Code |
|---|---|---|
| Prove theorems involving similarity | Students prove that two shapes are similar by showing their angles match and their sides scale by the same factor. This includes formal proofs about triangles, parallel lines, and proportional relationships. | G.SRT.B |
| Use congruence and similarity criteria for triangles to solve problems and… | Triangles that are the same shape or an exact copy of each other follow rules that let students solve for missing sides and angles, then use those same rules to explain why two shapes must be related in a certain way. | G.SRT.B.4 |
| Define trigonometric ratios, solve problems involving right triangles | Students learn what sine, cosine, and tangent mean as ratios of sides in a right triangle, then use those ratios to find missing side lengths and angles. | G.SRT.C |
| Use trigonometric ratios and the Pythagorean Theorem to solve right triangles | Given two pieces of information about a right triangle (like an angle and one side), students find all the missing side lengths and angles using sine, cosine, tangent, and the Pythagorean Theorem. | G.SRT.C.7 |
Adding, subtracting, multiplying, and dividing expressions with variables and fractions that contain variables. Students simplify and combine these expressions the same way they work with numbers.
Students learn that dividing a polynomial by (x - a) gives a remainder equal to the value of the polynomial at x = a. They use this shortcut to test whether a value is a root without doing the full division.
| Standard | Definition | Code |
|---|---|---|
| Perform operations on polynomials and rational expressions | Adding, subtracting, multiplying, and dividing expressions with variables and fractions that contain variables. Students simplify and combine these expressions the same way they work with numbers. | A2.APR.A |
| Understand the Remainder Theorem and use it to solve problems | Students learn that dividing a polynomial by (x - a) gives a remainder equal to the value of the polynomial at x = a. They use this shortcut to test whether a value is a root without doing the full division. | A2.APR.A.2 |
Students read a function and explain what it means for a real situation, like how a population grows or how a ball falls. They connect the math to the story behind it.
Reading a graph or table, students identify what key features like peaks, valleys, and direction changes actually mean for the situation being modeled, such as when a population peaked or how fast a cost grew.
A function is a rule that pairs each input with exactly one output. Students read function notation, interpret graphs and tables, and explain what the inputs and outputs mean in real situations.
Students read graphs, tables, and equations for linear, quadratic, and exponential functions to identify patterns like slope, vertex, or growth rate.
Reading a graph, table, or equation, students pick out key features like peaks, valleys, and patterns, then use those features to answer real math problems.
Students graph equations and read what the picture tells them: where the line crosses zero, which direction it curves, and whether it rises or falls over time.
| Standard | Definition | Code |
|---|---|---|
| Interpret linear, quadratic and exponential functions in terms of the context | Students read a function and explain what it means for a real situation, like how a population grows or how a ball falls. They connect the math to the story behind it. | A1.IF.B |
| Using tables, graphs and verbal descriptions, interpret key characteristics of… | Reading a graph or table, students identify what key features like peaks, valleys, and direction changes actually mean for the situation being modeled, such as when a population peaked or how fast a cost grew. | A1.IF.B.3 |
| Use and interpret functions | A function is a rule that pairs each input with exactly one output. Students read function notation, interpret graphs and tables, and explain what the inputs and outputs mean in real situations. | A2.IF.A |
| Analyze linear, quadratic and exponential functions using… | Students read graphs, tables, and equations for linear, quadratic, and exponential functions to identify patterns like slope, vertex, or growth rate. | A1.IF.C |
| Identify and interpret key characteristics of functions represented… | Reading a graph, table, or equation, students pick out key features like peaks, valleys, and patterns, then use those features to answer real math problems. | A2.IF.A.1 |
| Graph functions expressed symbolically and identify and interpret key features… | Students graph equations and read what the picture tells them: where the line crosses zero, which direction it curves, and whether it rises or falls over time. | A1.IF.C.7 |
Students use x and y coordinates to prove geometric facts, like whether a shape is a rectangle or whether two lines are parallel, without drawing a picture.
Students use x-y coordinates to prove geometric facts with algebra instead of diagrams. For example, they show that two lines are parallel, that a point lies on a circle, or that a shape has a right angle by working through the numbers.
| Standard | Definition | Code |
|---|---|---|
| Use coordinates to prove geometric theorems algebraically | Students use x and y coordinates to prove geometric facts, like whether a shape is a rectangle or whether two lines are parallel, without drawing a picture. | G.GPE.B |
| Use coordinates to prove geometric theorems algebraically | Students use x-y coordinates to prove geometric facts with algebra instead of diagrams. For example, they show that two lines are parallel, that a point lies on a circle, or that a shape has a right angle by working through the numbers. | G.GPE.B.3 |
Students learn to build new functions by shifting, stretching, or combining existing ones. A graph of a parabola, for example, can be moved up, flipped, or squeezed into a new shape by changing the equation.
Students combine two functions by adding, subtracting, multiplying, or dividing them to build a new one. They also chain functions together so the output of one becomes the input of the next.
Students take a function they already know, like a line or a parabola, and shift it, flip it, or stretch it to build a new one. The goal is to see how changing the equation changes the shape or position of the graph.
Students learn how shifting a graph up, down, left, or right changes its equation, and how stretching or compressing it changes its shape. The function stays the same type; its position and size change.
Students learn how shifting, flipping, or stretching a graph changes its equation. They practice spotting those changes in both the formula and the picture, working across a range of function types.
| Standard | Definition | Code |
|---|---|---|
| Create new functions from existing functions | Students learn to build new functions by shifting, stretching, or combining existing ones. A graph of a parabola, for example, can be moved up, flipped, or squeezed into a new shape by changing the equation. | A2.BF.A |
| Create new functions by applying the four arithmetic operations and composition… | Students combine two functions by adding, subtracting, multiplying, or dividing them to build a new one. They also chain functions together so the output of one becomes the input of the next. | A2.BF.A.1 |
| Build new functions from existing functions | Students take a function they already know, like a line or a parabola, and shift it, flip it, or stretch it to build a new one. The goal is to see how changing the equation changes the shape or position of the graph. | A1.BF.A |
| Analyze the effect of translations and scale changes on functions | Students learn how shifting a graph up, down, left, or right changes its equation, and how stretching or compressing it changes its shape. The function stays the same type; its position and size change. | A1.BF.A.1 |
| Describe the effects of transformations algebraically and graphically… | Students learn how shifting, flipping, or stretching a graph changes its equation. They practice spotting those changes in both the formula and the picture, working across a range of function types. | A2.BF.A.3 |
Students learn where volume formulas come from and use them to find the space inside cylinders, cones, pyramids, and spheres. The focus is on understanding the reasoning behind each formula, not just plugging in numbers.
Students apply volume formulas for cylinders, pyramids, cones, and spheres to solve real problems. This includes figures made by combining two or more of those shapes.
| Standard | Definition | Code |
|---|---|---|
| Explain volume formulas and use them to solve problems | Students learn where volume formulas come from and use them to find the space inside cylinders, cones, pyramids, and spheres. The focus is on understanding the reasoning behind each formula, not just plugging in numbers. | G.GMD.A |
| Use volume formulas for cylinders, pyramids, cones, spheres and… | Students apply volume formulas for cylinders, pyramids, cones, and spheres to solve real problems. This includes figures made by combining two or more of those shapes. | G.GMD.A.2 |
Students use shapes, measurements, and geometric formulas to model real-world situations, like estimating the area of a field or the volume of a structure. Geometry becomes a tool for solving practical problems, not just answering textbook exercises.
Students use shapes, measurements, and geometric rules to solve real-world design problems, like figuring out how much material a structure needs or whether an object will fit a given space.
| Standard | Definition | Code |
|---|---|---|
| Apply geometric concepts in modeling situations | Students use shapes, measurements, and geometric formulas to model real-world situations, like estimating the area of a field or the volume of a structure. Geometry becomes a tool for solving practical problems, not just answering textbook exercises. | G.MG.A |
| Apply geometric methods to solve design mathematical modeling problems | Students use shapes, measurements, and geometric rules to solve real-world design problems, like figuring out how much material a structure needs or whether an object will fit a given space. | G.MG.A.3 |
Students use equations and graphs to model situations like population growth, loan payments, or distance over time. The goal is choosing the right type of function and explaining what it predicts.
Students write quadratic and exponential equations to model real situations, like how fast a ball falls or how quickly a population grows, then use those equations to answer questions.
| Standard | Definition | Code |
|---|---|---|
| Use functions to model real-world problems | Students use equations and graphs to model situations like population growth, loan payments, or distance over time. The goal is choosing the right type of function and explaining what it predicts. | A2.FM.A |
| Create functions and use them to solve applications of quadratic and… | Students write quadratic and exponential equations to model real situations, like how fast a ball falls or how quickly a population grows, then use those equations to answer questions. | A2.FM.A.1 |
Students build equations and graphs for straight-line, curved, and fast-growing patterns, then compare them to figure out which model fits a real situation best.
Reading a graph, a table, or a word problem, students figure out whether a pattern is growing steadily, speeding up, or multiplying, then write the equation that matches it.
Students work with two types of number patterns: ones that grow by adding the same amount each time (like 3, 7, 11, 15) and ones that grow by multiplying by the same number each time (like 2, 6, 18, 54).
Students write formulas for number patterns that either grow by adding the same amount each step or by multiplying by the same amount each step. They switch between two formula styles: one that builds on the previous term and one that jumps straight to any term.
| Standard | Definition | Code |
|---|---|---|
| Construct and compare linear, quadratic and exponential models and… | Students build equations and graphs for straight-line, curved, and fast-growing patterns, then compare them to figure out which model fits a real situation best. | A1.LQE.A |
| Construct linear, quadratic and exponential equations given graphs, verbal… | Reading a graph, a table, or a word problem, students figure out whether a pattern is growing steadily, speeding up, or multiplying, then write the equation that matches it. | A1.LQE.A.3 |
| Use arithmetic and geometric sequences | Students work with two types of number patterns: ones that grow by adding the same amount each time (like 3, 7, 11, 15) and ones that grow by multiplying by the same number each time (like 2, 6, 18, 54). | A1.LQE.B |
| Write arithmetic and geometric sequences in recursive and explicit forms | Students write formulas for number patterns that either grow by adding the same amount each step or by multiplying by the same amount each step. They switch between two formula styles: one that builds on the previous term and one that jumps straight to any term. | A1.LQE.B.4 |
Students learn when two events are truly unrelated (like flipping a coin and rolling a die) versus when one event changes the odds of another. They use that thinking to read data tables and probability results accurately.
Students learn when two events have no effect on each other, then practice using that relationship to calculate the probability of both happening.
Conditional probability asks: does knowing one thing change the odds of another? Students learn to spot when two events affect each other and when they don't, then explain what that means using real data.
| Standard | Definition | Code |
|---|---|---|
| Understand independence and conditional probability and use them to interpret… | Students learn when two events are truly unrelated (like flipping a coin and rolling a die) versus when one event changes the odds of another. They use that thinking to read data tables and probability results accurately. | G.CP.A |
| Understand the definition of independent events and use it to solve problems | Students learn when two events have no effect on each other, then practice using that relationship to calculate the probability of both happening. | G.CP.A.2 |
| Recognize and explain the concepts of conditional probability and… | Conditional probability asks: does knowing one thing change the odds of another? Students learn to spot when two events affect each other and when they don't, then explain what that means using real data. | G.CP.A.5 |
Students look at data from surveys, experiments, and graphs to draw conclusions and explain the reasoning behind them.
Students look at a data set and decide whether a given equation or model actually fits the numbers, or whether the pattern in the data points to something different.
Students read graphs, tables, and data sets to spot patterns, draw conclusions, and describe what the numbers actually mean.
Students use survey or experiment data to estimate facts about a larger group, such as a city or a school. The margin of error tells them how close that estimate is likely to be to the real number.
Students read charts and graphs to describe what the data shows, spot patterns, and explain what those patterns mean.
Students learn to recognize when data forms a bell-curve shape and use that pattern to describe the spread and center of a data set.
Students learn the "bell curve" shape that many real-world data sets follow, then use it to estimate what percentage of results fall above or below a specific score based on how far that score sits from the average.
| Standard | Definition | Code |
|---|---|---|
| Make inferences and justify conclusions | Students look at data from surveys, experiments, and graphs to draw conclusions and explain the reasoning behind them. | A2.DS.A |
| Determine whether a specified model is consistent with a given data set | Students look at a data set and decide whether a given equation or model actually fits the numbers, or whether the pattern in the data points to something different. | A2.DS.A.2 |
| Summarize, represent and interpret data | Students read graphs, tables, and data sets to spot patterns, draw conclusions, and describe what the numbers actually mean. | A1.DS.A |
| Use data from a sample to estimate characteristics of the population and… | Students use survey or experiment data to estimate facts about a larger group, such as a city or a school. The margin of error tells them how close that estimate is likely to be to the real number. | A2.DS.A.4 |
| Analyze and interpret graphical displays of data | Students read charts and graphs to describe what the data shows, spot patterns, and explain what those patterns mean. | A1.DS.A.1 |
| Fit a data set to a normal distribution | Students learn to recognize when data forms a bell-curve shape and use that pattern to describe the spread and center of a data set. | A2.DS.B |
| Know and use the characteristics of normally distributed data sets | Students learn the "bell curve" shape that many real-world data sets follow, then use it to estimate what percentage of results fall above or below a specific score based on how far that score sits from the average. | A2.DS.B.8 |
End-of-course assessment taken when students complete Algebra I. Districts must ensure students complete the Algebra I EOC prior to graduation.
Alternate assessment for eligible students with significant cognitive disabilities, covering the state-tested grade-level and end-of-course subjects.
This is a big year. Students work through algebra (solving equations, graphing lines and parabolas, building functions), some geometry (shapes, proofs, right triangles), and an introduction to statistics. Most students take Algebra 1, Geometry, or Algebra 2 depending on their track.
Ask the student to explain a homework problem out loud, step by step. If they get stuck, ask what the question is really asking and what they already know. Teaching it back is one of the strongest ways to lock in a skill, and it takes about ten minutes.
Both. Students should be quick with mental math on small numbers and comfortable with a calculator for messy ones. A graphing calculator (or a free app like Desmos) is worth having at home for graphing lines, parabolas, and exponential curves.
Solve and graph linear, quadratic, and simple exponential equations. Work with right triangles using the Pythagorean Theorem and basic trig ratios. Read a data display and describe what it shows. Algebra 2 students also work with logarithms and complex numbers.
Most teachers anchor the first semester in linear functions and equation solving, then move into quadratics and other nonlinear functions in the spring. Geometry courses usually run transformations and congruence first, then similarity and right-triangle trig, with volume and modeling near the end.
Factoring quadratics, the difference between an expression and an equation, and anything involving negative signs. In geometry, students often need extra time with proofs and with setting up trig ratios correctly. Build in spiral review rather than waiting until the unit test.
Find out which earlier skill is missing. Often it is fractions, negative numbers, or solving a basic equation. Shoring up that one gap usually unlocks the current work faster than drilling the new topic. Ask the teacher what to focus on for fifteen minutes a few nights a week.
Look for fluency, not just correct answers. Students should solve a quadratic more than one way, explain why a graph looks the way it does, and apply a formula to a word problem they have not seen before. If they can do that under light time pressure, they are ready.