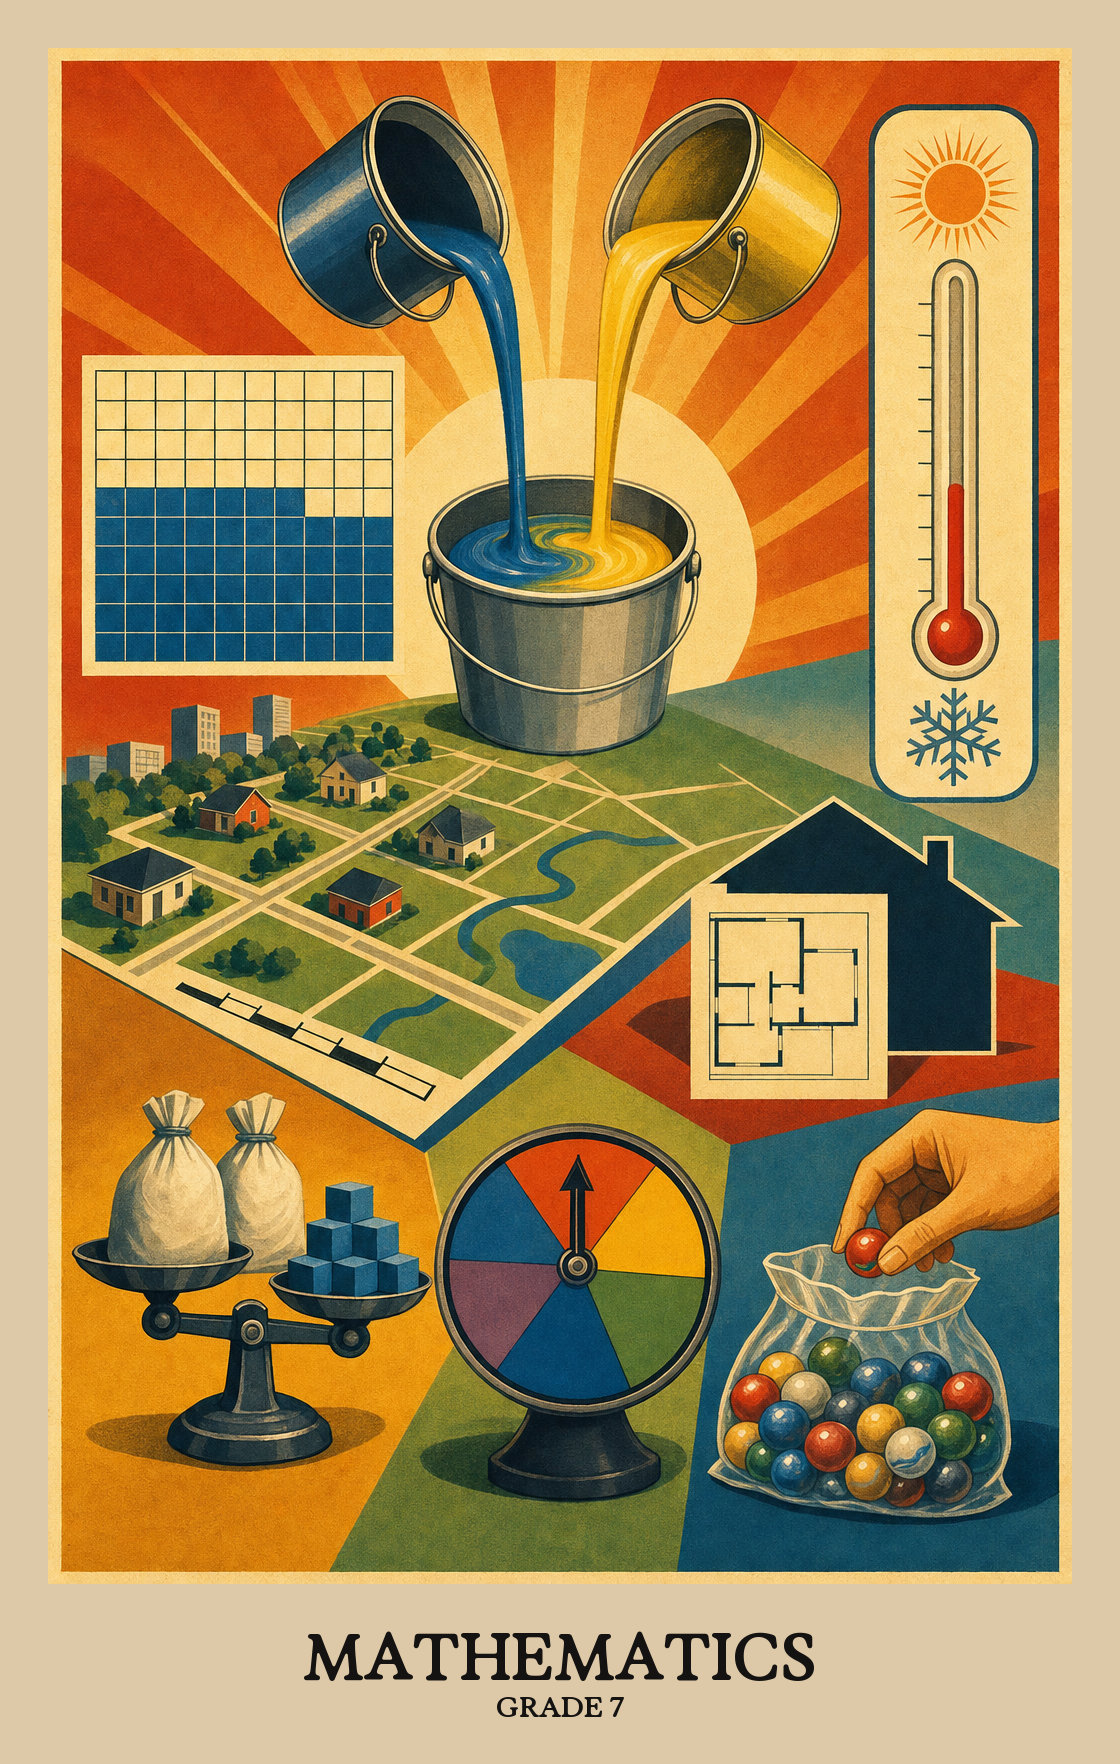
Understand that statistics can be used to gain information about a population… | A survey or poll only tells you something true about a whole group if the people sampled actually represent that group. Students learn why random sampling matters and how to collect a sample that holds up. | NC.7.SP.1 |
Generate multiple random samples | Students collect several random samples of the same size, compare what each one shows, and use the differences between samples to make a reasonable guess about a larger group. | NC.7.SP.2 |
Recognize the role of variability when comparing two populations | Students learn to compare two groups by looking at how spread out each group's data is, not just the averages. A wider spread means the data is less predictable, which matters when deciding if the two groups are really different. | NC.7.SP.3 |
Calculate the measure of variability of a data set and understand that it… | Students learn three ways to describe how spread out a set of numbers is: the range (gap between the highest and lowest values), the interquartile range (spread of the middle half), and the mean absolute deviation (average distance each value sits from the middle). | NC.7.SP.3.a |
Informally assess the difference between two data sets by examining the overlap… | Students look at two graphs side by side and judge how much the data overlaps or stays separate, using that visual gap to decide how different the two groups really are. | NC.7.SP.3.b |
Use measures of center and measures of variability for numerical data from… | Students compare two groups using their averages and how spread out their numbers are. For example, they might use survey data to decide whether seventh graders or eighth graders tend to sleep more, and how consistent those patterns are. | NC.7.SP.4 |
Understand that the probability of a chance event is a number between 0 and 1… | Probability is a number from 0 to 1 that shows how likely something is to happen. A probability of 0 means it will never happen, and a probability of 1 means it will always happen. Numbers in between show how likely or unlikely an event is. | NC.7.SP.5 |
Collect data to calculate the experimental probability of a chance event… | Flip a coin or roll a die many times, record the results, and use that data to figure out how often something is likely to happen. The more trials students run, the closer their results get to the true probability. | NC.7.SP.6 |
Develop a probability model and use it to find probabilities of simple events | Students build a simple probability model, like a number cube or spinner, and use it to predict how likely a single outcome is to happen. | NC.7.SP.7 |
Develop a uniform probability model by assigning equal probability to all… | Students learn to assign equal chances to every possible outcome of a simple experiment, like rolling a number cube, then use those equal chances to figure out how likely a specific result is. | NC.7.SP.7.a |
Develop a probability model | Students run an experiment many times, like flipping a coin or spinning a spinner, and use the results to build a model that predicts how often each outcome is likely to happen. | NC.7.SP.7.b |
Compare theoretical and experimental probabilities from a model to observed… | Students run an experiment, then compare what actually happened to what the math predicted would happen. If the results don't match, students explain why, such as too few trials or an uneven spinner. | NC.7.SP.7.c |
Determine probabilities of compound events using organized lists, tables, tree… | Students figure out the chances of two or more things happening together, like flipping a coin and rolling a die at the same time. They use lists, tables, and branching diagrams to map out every possible outcome. | NC.7.SP.8 |
Understand that, just as with simple events, the probability of a compound… | When two things happen together (like flipping a coin and rolling a die), students find the probability the same way they would for a single event: count the outcomes that match, then divide by the total number of possible outcomes. | NC.7.SP.8.a |
For an event described in everyday language, identify the outcomes in the… | Given a real situation like flipping two coins or rolling two number cubes, students find all possible results by reading a list, table, or tree diagram, then pick out which results match the event they are studying. | NC.7.SP.8.b |
Design and use a simulation to generate frequencies for compound events | Students build a simple experiment, like flipping coins or rolling dice, to estimate how often two events happen together. They run the simulation and use the results to predict real-world probabilities. | NC.7.SP.8.c |