Rational numbers and square roots
Students compare and order positive and negative fractions, decimals, and percents on a number line. They also learn what a square root is and find square roots of familiar numbers up to 400.
This is the year math shifts from arithmetic to real algebra. Students start writing equations with letters like y = mx, solving two-step problems for an unknown, and graphing straight lines that show how one quantity changes with another. They also work with ratios to handle scale drawings and similar shapes. By spring, students can solve a word problem by writing an equation, finding the missing value, and explaining what it means.
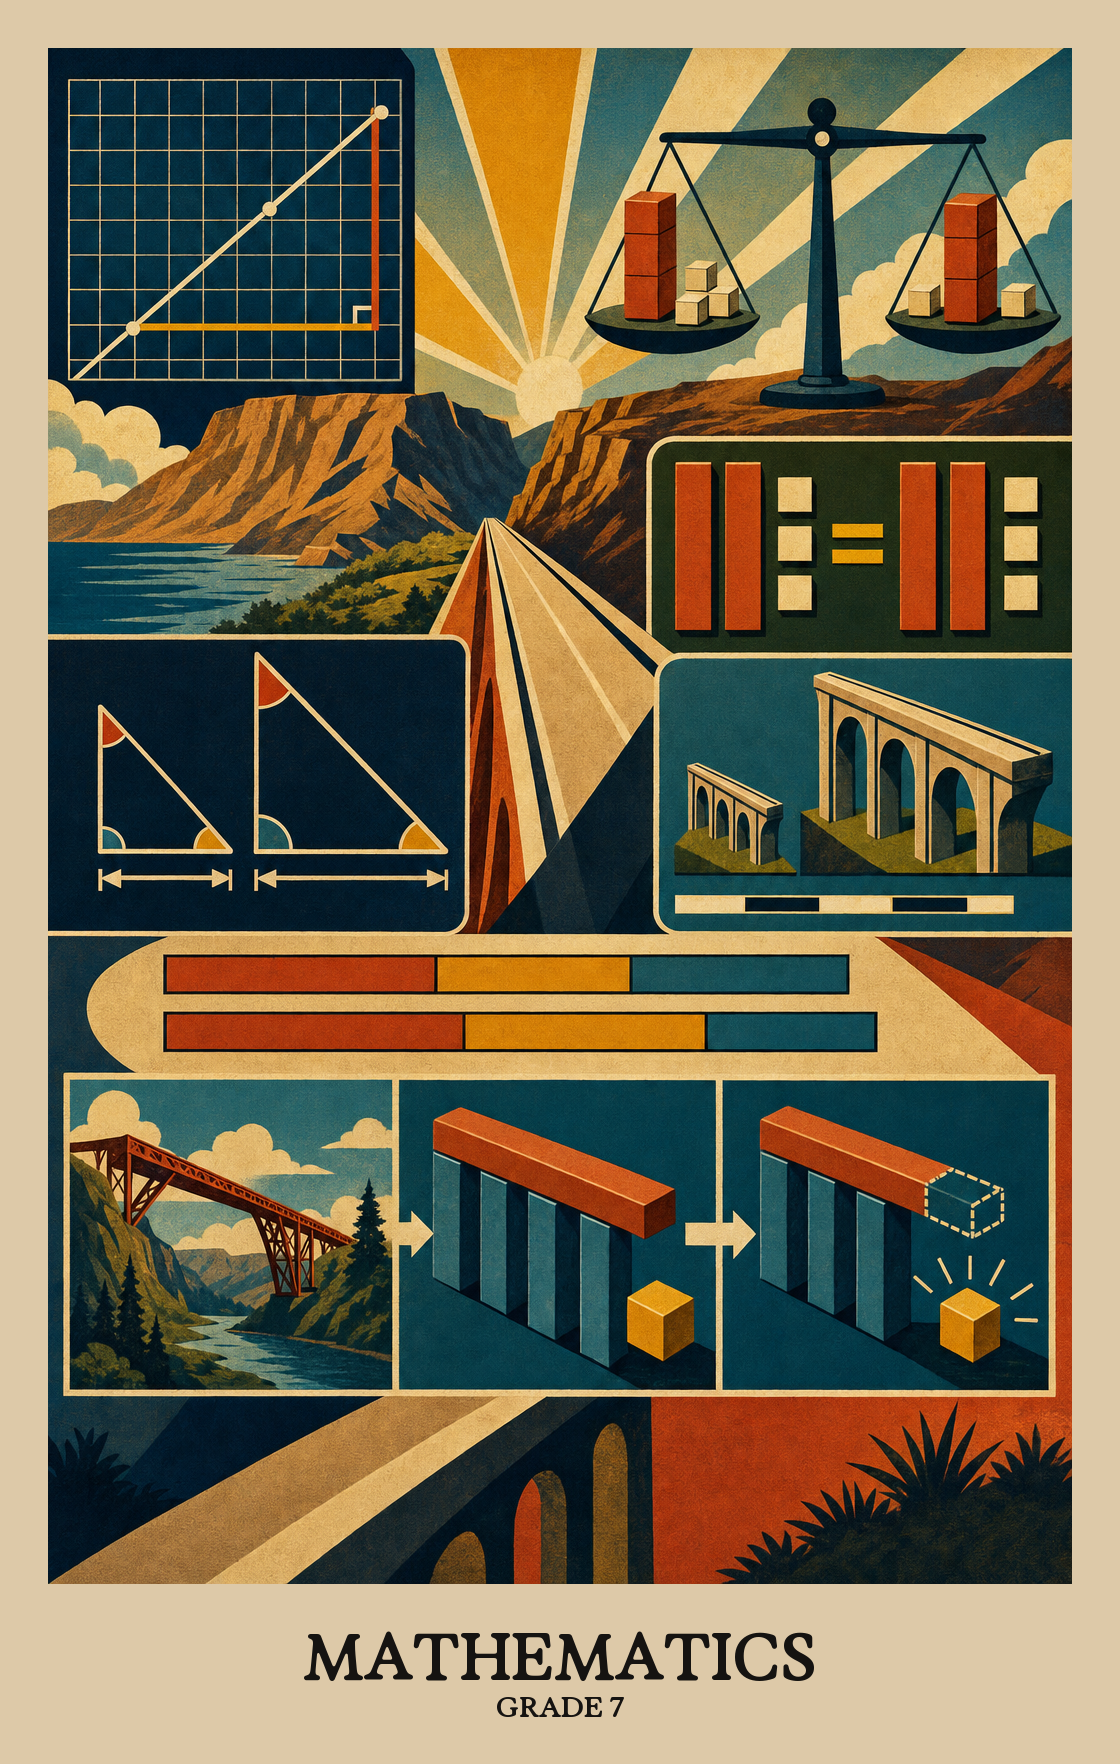
Students compare and order positive and negative fractions, decimals, and percents on a number line. They also learn what a square root is and find square roots of familiar numbers up to 400.
Students work with very large numbers written in shorthand, like 3.2 times ten to a power. They also see what happens when ten is raised to a negative power, which produces small decimals and fractions.
Students use ratio tables and proportions to solve real problems, such as converting units, scaling a recipe, or finding a percent of a number. Expect homework about tips, discounts, and maps.
Students simplify expressions with variables and solve two-step equations like 3x + 5 = 20. They also solve inequalities and graph the answers on a number line.
Students graph lines that pass through the origin and connect tables, equations like y = mx, and graphs. They learn to read slope as a rate of change, such as miles per hour or dollars per shirt.
Students find the volume and surface area of boxes and cylinders, work with similar shapes and scale drawings, and dilate figures on a grid. They also build histograms and compare experimental results to expected probability.
Students learn what it means to write very large numbers using powers of ten, like expressing 4,000,000 as 4 x 10 to the sixth power. They practice putting those numbers in order from smallest to largest.
Students look at patterns to understand what negative exponents mean in powers of 10, learning that 10⁻¹ equals 0.1, 10⁻² equals 0.01, and so on. Each step left on the exponent divides the value by ten.
Negative exponents on powers of 10 mean the number is a fraction smaller than one. Students write the same value three ways: as 10 to a negative power, as a fraction with a power of 10 on the bottom, and as a decimal.
Students practice writing very large or very small numbers two ways: as a plain decimal and in scientific notation, which uses a power of ten as a shortcut. They switch back and forth between the two forms until both make sense.
Numbers in scientific notation look like 3.2 x 10^5. Students put up to four of these numbers in order from smallest to largest or largest to smallest by comparing the powers of ten and the digits out front.
Students sort fractions, decimals, and negative numbers from least to greatest and explain which is bigger or smaller. They use number lines, conversion, and other methods to make the comparison.
Students compare and order up to four numbers, which can be fractions, decimals, mixed numbers, or percents, using symbols like < and >. They explain their reasoning out loud, in writing, or with a number line.
Students learn that squaring a whole number and finding a square root are opposite operations. For example, 3 squared is 9, and the square root of 9 is 3.
Students find the number that, when multiplied by itself, produces a given perfect square. They work with perfect squares from 0 to 400, such as recognizing that the square root of 144 is 12.
Squaring a number and taking its square root are opposite operations. Students learn that if 4 x 4 = 16, then the square root of 16 is 4, and practice moving in both directions between a perfect square and its root.
| Standard | Definition | Code |
|---|---|---|
| The student will investigate and describe the concept of exponents for powers… | Students learn what it means to write very large numbers using powers of ten, like expressing 4,000,000 as 4 x 10 to the sixth power. They practice putting those numbers in order from smallest to largest. | 7.NS.1 |
| Investigate and describe powers of 10 with negative exponents by examining… | Students look at patterns to understand what negative exponents mean in powers of 10, learning that 10⁻¹ equals 0.1, 10⁻² equals 0.01, and so on. Each step left on the exponent divides the value by ten. | 7.NS.1.a |
| Represent a power of 10 with a negative exponent in fraction and decimal form | Negative exponents on powers of 10 mean the number is a fraction smaller than one. Students write the same value three ways: as 10 to a negative power, as a fraction with a power of 10 on the bottom, and as a decimal. | 7.NS.1.b |
| Convert between numbers greater than 0 written in scientific notation and… | Students practice writing very large or very small numbers two ways: as a plain decimal and in scientific notation, which uses a power of ten as a shortcut. They switch back and forth between the two forms until both make sense. | 7.NS.1.c |
| Compare and order no more than four numbers greater than 0 written in… | Numbers in scientific notation look like 3.2 x 10^5. Students put up to four of these numbers in order from smallest to largest or largest to smallest by comparing the powers of ten and the digits out front. | 7.NS.1.d |
| The student will reason and use multiple strategies to compare and order… | Students sort fractions, decimals, and negative numbers from least to greatest and explain which is bigger or smaller. They use number lines, conversion, and other methods to make the comparison. | 7.NS.2 |
| Use multiple strategies | Students compare and order up to four numbers, which can be fractions, decimals, mixed numbers, or percents, using symbols like < and >. They explain their reasoning out loud, in writing, or with a number line. | 7.NS.2.a |
| The student will recognize and describe the relationship between square roots… | Students learn that squaring a whole number and finding a square root are opposite operations. For example, 3 squared is 9, and the square root of 9 is 3. | 7.NS.3 |
| Determine the positive square root of a perfect square from 0 to 400.* | Students find the number that, when multiplied by itself, produces a given perfect square. They work with perfect squares from 0 to 400, such as recognizing that the square root of 144 is 12. | 7.NS.3.a |
| Describe the relationship between square roots and perfect squares.* | Squaring a number and taking its square root are opposite operations. Students learn that if 4 x 4 = 16, then the square root of 16 is 4, and practice moving in both directions between a perfect square and its root. | 7.NS.3.b |
Students add, subtract, multiply, and divide integers, fractions, and decimals by hand and with a calculator. The focus is on choosing the right approach and knowing whether the answer makes sense.
Students measure, compare, and draw shapes using tools like rulers and protractors. They apply formulas for area, surface area, and volume to solve real problems.
| Standard | Definition | Code |
|---|---|---|
| Computation and Estimation | Students add, subtract, multiply, and divide integers, fractions, and decimals by hand and with a calculator. The focus is on choosing the right approach and knowing whether the answer makes sense. | 7.CE |
| Measurement and Geometry | Students measure, compare, and draw shapes using tools like rulers and protractors. They apply formulas for area, surface area, and volume to solve real problems. | 7.MG |
Students work through real-world word problems that take more than one step, using positive and negative numbers, fractions, and decimals. They solve the problem and explain why their answer makes sense.
Students add, subtract, multiply, and divide with positive and negative numbers, including fractions, mixed numbers, and decimals. They also check whether their answers make sense in real-world situations.
Students use ratios and unit rates to solve real-world problems, like finding the cost of multiple items or comparing speeds. If two quantities change at the same rate, students can use that relationship to find a missing value.
Students fill in a ratio table to find missing numbers when two quantities change together at a steady rate, like miles and hours or dollars and items.
Students set up a proportion as two equal fractions, then solve for the missing number. The work often comes from a real situation, like finding the cost of more items when you know the price of a few.
Students use a known conversion factor to switch between units, like turning miles into kilometers or pounds into ounces, by setting up and solving a proportion. The math stays the same; only the units change.
Students figure out what a percentage of a whole number equals, like finding 30% of 240 or estimating a tip on a dinner bill. They use benchmark percentages such as 10%, 25%, and 50% as shortcuts when an exact answer isn't needed.
| Standard | Definition | Code |
|---|---|---|
| The student will estimate, solve | Students work through real-world word problems that take more than one step, using positive and negative numbers, fractions, and decimals. They solve the problem and explain why their answer makes sense. | 7.CE.1 |
| Estimate, solve, and justify solutions to contextual problems involving… | Students add, subtract, multiply, and divide with positive and negative numbers, including fractions, mixed numbers, and decimals. They also check whether their answers make sense in real-world situations. | 7.CE.1.a |
| The student will solve problems, including those in context, involving… | Students use ratios and unit rates to solve real-world problems, like finding the cost of multiple items or comparing speeds. If two quantities change at the same rate, students can use that relationship to find a missing value. | 7.CE.2 |
| Given a proportional relationship between two quantities, create and use a… | Students fill in a ratio table to find missing numbers when two quantities change together at a steady rate, like miles and hours or dollars and items. | 7.CE.2.a |
| Write and solve a proportion that represents a proportional relationship… | Students set up a proportion as two equal fractions, then solve for the missing number. The work often comes from a real situation, like finding the cost of more items when you know the price of a few. | 7.CE.2.b |
| Apply proportional reasoning to solve problems in context, including converting… | Students use a known conversion factor to switch between units, like turning miles into kilometers or pounds into ounces, by setting up and solving a proportion. The math stays the same; only the units change. | 7.CE.2.c |
| Estimate and determine the percentage of a given whole number, including but… | Students figure out what a percentage of a whole number equals, like finding 30% of 240 or estimating a tip on a dinner bill. They use benchmark percentages such as 10%, 25%, and 50% as shortcuts when an exact answer isn't needed. | 7.CE.2.d |
Students figure out how to calculate the space inside a cylinder, like a soup can or water tank, then use that formula to solve real problems. They work with physical objects and diagrams before moving to the formula itself.
Students learn where the surface area formula for a box or a can comes from, then use it to solve real problems. They work with physical objects, flat diagrams, and unfolded nets before moving to the formula alone.
Students read a word problem about a box or a can and decide whether it's asking about the space inside or the material covering the outside.
Students figure out what happens to the volume of a box-shaped object when one measurement (length, width, or height) is doubled, tripled, halved, or cut to a quarter of its original size.
Students explore what happens to the surface area of a box when one measurement, like its height or width, is cut in half or doubled. Changing just one side does not change the total surface area by the same factor.
Similar shapes have matching angles and sides that grow or shrink by the same ratio. Students use that relationship to find missing lengths and solve real problems, like scaling a drawing or comparing two triangles.
Similar shapes have matching angles that are exactly equal. Students identify those paired angles in triangles and quadrilaterals by reading the tick marks and arc symbols drawn on the figures.
Students look at two shapes that have the same angles but different sizes and name which side of one matches which side of the other. This is the first step in using ratios to find a missing length.
Given two shapes that are the same except for size, students write a formal statement matching each corner of one shape to the matching corner of the other, using the correct mathematical symbols.
Two shapes are similar when one is a scaled version of the other. Students write fractions showing how each side of one shape compares to the matching side of the other, then confirm those fractions are equal.
Students compare the side lengths of two shapes, like two rectangles or two triangles, to see if every pair of matching sides has the same ratio. If the ratios all match, the shapes are similar, just scaled up or down.
Students find a missing side length of two shapes that have the same angles but different sizes, like a small and large version of the same triangle or rectangle. They set up a ratio and solve for the unknown measurement.
Two shapes are similar when they have the same angles but different sizes. Students use a known angle in one triangle or four-sided figure to find a missing angle in its similar partner.
Students use scale drawings like maps or blueprints to find real measurements. They set up a ratio between the drawing and actual size, then solve for the missing dimension.
Students sort squares, rectangles, parallelograms, and other four-sided shapes by their angles and side lengths, then use what they know about those properties to find missing measurements.
Students sort and compare four-sided shapes by looking at which sides are parallel, which sides are equal, and which corners are right angles. Parallelograms, rectangles, squares, rhombuses, and trapezoids each have their own set of rules.
Students look at four-sided shapes like squares, rectangles, and trapezoids and sort them by which sides run parallel, which meet at right angles, and how their corner-to-corner lines behave.
Students compare squares, rectangles, trapezoids, and other four-sided shapes to figure out which angles and sides are equal in size. They use what they know about one shape to find missing measurements in another.
Students look at squares, rectangles, trapezoids, and other four-sided shapes to find lines of symmetry, then compare which shapes have more or fewer than others.
Students sort four-sided shapes into groups like rectangles, squares, and trapezoids by comparing their sides and angles to see which rules each shape follows.
Students sort shapes like rectangles, squares, and trapezoids by examining which sides run parallel, which meet at right angles, and how the corner-to-corner lines inside each shape behave.
Students sort shapes like rectangles, squares, and trapezoids into groups by comparing their angles, side lengths, and diagonals to see which properties each shape shares or doesn't share.
Students sort shapes like rectangles, squares, and trapezoids by whether they have lines of symmetry, the invisible fold lines that split a shape into two matching halves.
Students find a missing angle inside a four-sided shape by using the rule that all four angles add up to 360 degrees. They work backward from the angles they already know to find the one that's missing.
Students find a missing side length in a four-sided shape by using what they know about that shape's properties, such as equal sides or parallel sides.
Students resize shapes on a grid by shrinking or stretching each point by the same scale factor from a center point. The result is a larger or smaller version of the original shape that keeps the same angles and proportions.
Given a polygon on a grid, students find where each corner lands after it is scaled up or shrunk from the origin using a set scale factor. A corner at (2, 4) doubled becomes (4, 8).
Students resize a polygon on a coordinate grid by multiplying each corner's coordinates by a set number, making the shape larger or smaller while keeping its proportions. Scale factors used are 1/4, 1/2, 2, 3, or 4.
Students look at real-world examples like maps, blueprints, or logos and identify when a shape has been scaled up or scaled down. They describe what changed in size and what stayed the same.
| Standard | Definition | Code |
|---|---|---|
| Develop the formulas for determining the volume of right cylinders and solve… | Students figure out how to calculate the space inside a cylinder, like a soup can or water tank, then use that formula to solve real problems. They work with physical objects and diagrams before moving to the formula itself. | 7.MG.1.a |
| Develop the formulas for determining the surface area of rectangular prisms and… | Students learn where the surface area formula for a box or a can comes from, then use it to solve real problems. They work with physical objects, flat diagrams, and unfolded nets before moving to the formula alone. | 7.MG.1.b |
| Determine if a problem in context, involving a rectangular prism or right… | Students read a word problem about a box or a can and decide whether it's asking about the space inside or the material covering the outside. | 7.MG.1.c |
| Describe how the volume of a rectangular prism is affected when one measured… | Students figure out what happens to the volume of a box-shaped object when one measurement (length, width, or height) is doubled, tripled, halved, or cut to a quarter of its original size. | 7.MG.1.d |
| Describe how the surface area of a rectangular prism is affected when one… | Students explore what happens to the surface area of a box when one measurement, like its height or width, is cut in half or doubled. Changing just one side does not change the total surface area by the same factor. | 7.MG.1.e |
| The student will solve problems and justify relationships of similarity… | Similar shapes have matching angles and sides that grow or shrink by the same ratio. Students use that relationship to find missing lengths and solve real problems, like scaling a drawing or comparing two triangles. | 7.MG.2 |
| Identify corresponding congruent angles of similar quadrilaterals and… | Similar shapes have matching angles that are exactly equal. Students identify those paired angles in triangles and quadrilaterals by reading the tick marks and arc symbols drawn on the figures. | 7.MG.2.a |
| Identify corresponding sides of similar quadrilaterals and triangles | Students look at two shapes that have the same angles but different sizes and name which side of one matches which side of the other. This is the first step in using ratios to find a missing length. | 7.MG.2.b |
| Given two similar quadrilaterals or triangles, write similarity statements… | Given two shapes that are the same except for size, students write a formal statement matching each corner of one shape to the matching corner of the other, using the correct mathematical symbols. | 7.MG.2.c |
| Write proportions to express the relationships between the lengths of… | Two shapes are similar when one is a scaled version of the other. Students write fractions showing how each side of one shape compares to the matching side of the other, then confirm those fractions are equal. | 7.MG.2.d |
| Recognize and justify if two quadrilaterals or triangles are similar using the… | Students compare the side lengths of two shapes, like two rectangles or two triangles, to see if every pair of matching sides has the same ratio. If the ratios all match, the shapes are similar, just scaled up or down. | 7.MG.2.e |
| Solve a proportion to determine a missing side length of similar quadrilaterals… | Students find a missing side length of two shapes that have the same angles but different sizes, like a small and large version of the same triangle or rectangle. They set up a ratio and solve for the unknown measurement. | 7.MG.2.f |
| Given angle measures in a quadrilateral or triangle, determine unknown angle… | Two shapes are similar when they have the same angles but different sizes. Students use a known angle in one triangle or four-sided figure to find a missing angle in its similar partner. | 7.MG.2.g |
| Apply proportional reasoning to solve problems in context including scale… | Students use scale drawings like maps or blueprints to find real measurements. They set up a ratio between the drawing and actual size, then solve for the missing dimension. | 7.MG.2.h |
| The student will compare and contrast quadrilaterals based on their properties… | Students sort squares, rectangles, parallelograms, and other four-sided shapes by their angles and side lengths, then use what they know about those properties to find missing measurements. | 7.MG.3 |
| Compare and contrast properties of the following quadrilaterals | Students sort and compare four-sided shapes by looking at which sides are parallel, which sides are equal, and which corners are right angles. Parallelograms, rectangles, squares, rhombuses, and trapezoids each have their own set of rules. | 7.MG.3.a |
| Compare and contrast properties of quadrilaterals to determine… | Students look at four-sided shapes like squares, rectangles, and trapezoids and sort them by which sides run parallel, which meet at right angles, and how their corner-to-corner lines behave. | 7.MG.3.a.i |
| Compare and contrast properties of quadrilaterals to determine congruence of… | Students compare squares, rectangles, trapezoids, and other four-sided shapes to figure out which angles and sides are equal in size. They use what they know about one shape to find missing measurements in another. | 7.MG.3.a.ii |
| Compare and contrast properties of quadrilaterals to determine lines of symmetry | Students look at squares, rectangles, trapezoids, and other four-sided shapes to find lines of symmetry, then compare which shapes have more or fewer than others. | 7.MG.3.a.iii |
| Sort and classify quadrilaterals as parallelograms, rectangles, trapezoids… | Students sort four-sided shapes into groups like rectangles, squares, and trapezoids by comparing their sides and angles to see which rules each shape follows. | 7.MG.3.b |
| Sort and classify quadrilaterals as parallelograms, rectangles, trapezoids… | Students sort shapes like rectangles, squares, and trapezoids by examining which sides run parallel, which meet at right angles, and how the corner-to-corner lines inside each shape behave. | 7.MG.3.b.i |
| Sort and classify quadrilaterals as parallelograms, rectangles, trapezoids… | Students sort shapes like rectangles, squares, and trapezoids into groups by comparing their angles, side lengths, and diagonals to see which properties each shape shares or doesn't share. | 7.MG.3.b.ii |
| Sort and classify quadrilaterals as parallelograms, rectangles, trapezoids… | Students sort shapes like rectangles, squares, and trapezoids by whether they have lines of symmetry, the invisible fold lines that split a shape into two matching halves. | 7.MG.3.b.iii |
| Given a diagram, determine an unknown angle measure in a quadrilateral, using… | Students find a missing angle inside a four-sided shape by using the rule that all four angles add up to 360 degrees. They work backward from the angles they already know to find the one that's missing. | 7.MG.3.c |
| Given a diagram, determine an unknown side length in a quadrilateral using… | Students find a missing side length in a four-sided shape by using what they know about that shape's properties, such as equal sides or parallel sides. | 7.MG.3.d |
| The student will apply dilations of polygons in the coordinate plane | Students resize shapes on a grid by shrinking or stretching each point by the same scale factor from a center point. The result is a larger or smaller version of the original shape that keeps the same angles and proportions. | 7.MG.4 |
| Given a preimage in the coordinate plane, identify the coordinates of the image… | Given a polygon on a grid, students find where each corner lands after it is scaled up or shrunk from the origin using a set scale factor. A corner at (2, 4) doubled becomes (4, 8). | 7.MG.4.a |
| Sketch the image of a dilation of a polygon limited to a scale factor of… | Students resize a polygon on a coordinate grid by multiplying each corner's coordinates by a set number, making the shape larger or smaller while keeping its proportions. Scale factors used are 1/4, 1/2, 2, 3, or 4. | 7.MG.4.b |
| Identify and describe dilations in context including | Students look at real-world examples like maps, blueprints, or logos and identify when a shape has been scaled up or scaled down. They describe what changed in size and what stayed the same. | 7.MG.4.c |
Students run experiments (like flipping a coin or rolling a die) to find how often something actually happens, then compare that result to what math says should happen. The two numbers rarely match exactly, and that gap is the point.
Theoretical probability is what math predicts should happen before any experiment runs. Students calculate it by dividing the number of favorable outcomes by the total possible outcomes, like finding the chance of rolling a 3 on a number cube.
Students look at real data collected from an experiment (like flipping a coin 50 times) and use those actual results to figure out how likely that event is to happen.
More coin flips or dice rolls means the results get closer to what math predicts should happen. Students explain how experimental probability shifts toward the expected value as the number of trials grows.
Running an experiment (like flipping a coin 50 times) often gives results that differ from the math-predicted odds. Students compare what actually happened in a trial to what the numbers say should happen.
Students design a question, gather data, and build a histogram to show the results. They then explain what the histogram reveals about patterns in the data.
Students come up with a question worth investigating, one where the answer requires gathering real data that can be displayed in a histogram (a bar-style graph showing how often values fall in a range).
Students figure out what information they need to answer a question, then gather it by observing, measuring, surveying, or running a simple experiment.
Students learn why a bigger, randomly chosen group gives a truer picture of everyone. A small or hand-picked sample can skew results, so size and how people are chosen both matter.
Students group numerical data into ranges and draw a bar chart where each bar shows how many values fall in that range. The bars touch each other, which is what makes a histogram different from a regular bar graph.
Changing the bar widths in a histogram can make the same data look very different. Students explore how wider or narrower intervals shift what a graph appears to show.
Students look at the same set of data displayed in two or more chart types, such as a histogram and a dot plot, then decide which chart makes the data easiest to read and explain why.
Students read a histogram to spot patterns in data, such as where values cluster or spread out, then explain what those patterns mean. They also compare the histogram to the original numbers to see what the graph reveals that a plain list of numbers hides.
| Standard | Definition | Code |
|---|---|---|
| The student will use statistical investigation to determine the probability of… | Students run experiments (like flipping a coin or rolling a die) to find how often something actually happens, then compare that result to what math says should happen. The two numbers rarely match exactly, and that gap is the point. | 7.PS.1 |
| Determine the theoretical probability of an event | Theoretical probability is what math predicts should happen before any experiment runs. Students calculate it by dividing the number of favorable outcomes by the total possible outcomes, like finding the chance of rolling a 3 on a number cube. | 7.PS.1.a |
| Given the results of a statistical investigation, determine the experimental… | Students look at real data collected from an experiment (like flipping a coin 50 times) and use those actual results to figure out how likely that event is to happen. | 7.PS.1.b |
| Describe changes in the experimental probability as the number of trials… | More coin flips or dice rolls means the results get closer to what math predicts should happen. Students explain how experimental probability shifts toward the expected value as the number of trials grows. | 7.PS.1.c |
| Investigate and describe the difference between the probability of an event… | Running an experiment (like flipping a coin 50 times) often gives results that differ from the math-predicted odds. Students compare what actually happened in a trial to what the numbers say should happen. | 7.PS.1.d |
| The student will apply the data cycle | Students design a question, gather data, and build a histogram to show the results. They then explain what the histogram reveals about patterns in the data. | 7.PS.2 |
| Formulate questions that require the collection or acquisition of data with a… | Students come up with a question worth investigating, one where the answer requires gathering real data that can be displayed in a histogram (a bar-style graph showing how often values fall in a range). | 7.PS.2.a |
| Determine the data needed to answer a formulated question and collect the data | Students figure out what information they need to answer a question, then gather it by observing, measuring, surveying, or running a simple experiment. | 7.PS.2.b |
| Determine how sample size and randomness will ensure that the data collected is… | Students learn why a bigger, randomly chosen group gives a truer picture of everyone. A small or hand-picked sample can skew results, so size and how people are chosen both matter. | 7.PS.2.c |
| Organize and represent numerical data using histograms with and without the use… | Students group numerical data into ranges and draw a bar chart where each bar shows how many values fall in that range. The bars touch each other, which is what makes a histogram different from a regular bar graph. | 7.PS.2.d |
| Investigate and explain how using different intervals could impact the… | Changing the bar widths in a histogram can make the same data look very different. Students explore how wider or narrower intervals shift what a graph appears to show. | 7.PS.2.e |
| Compare data represented in histograms with the same data represented in other… | Students look at the same set of data displayed in two or more chart types, such as a histogram and a dot plot, then decide which chart makes the data easiest to read and explain why. | 7.PS.2.f |
| Analyze data represented in histograms by making observations and drawing… | Students read a histogram to spot patterns in data, such as where values cluster or spread out, then explain what those patterns mean. They also compare the histogram to the original numbers to see what the graph reveals that a plain list of numbers hides. | 7.PS.2.g |
Students examine how two quantities grow together at a steady rate, moving between word problems, tables, equations, and graphs to describe the same relationship four different ways.
Students find the rate of change between two related quantities, then write an equation in the form y = mx to match it. The slope m can be positive or negative depending on whether the relationship is growing or shrinking.
Students look at a line on a graph and describe which direction it runs: slanting up, slanting down, or perfectly flat.
Students plot a straight line on a graph when they know one point and how steeply the line rises or falls. The steepness (slope) can go upward or downward and shows how two quantities change together at a steady rate.
Students plot a straight line on a graph using an equation like y = 3x, where the number multiplied by x controls how steeply the line rises or falls. Positive slopes go upward left to right; negative slopes go downward.
Students connect different ways of showing the same proportional relationship: a table of values, an equation like y = mx, and a graph. Given one representation, they explain what it looks like in the others.
Students simplify math expressions like 3x + 2x into 5x, swap in a number for the variable, and find the result. The work builds the algebra skills students use throughout middle and high school math.
Students follow the correct sequence of steps to simplify math expressions that include exponents, brackets, and absolute values. Bases are positive whole numbers and exponents go up to 4.
Students use hands-on tools like colored chips or tiles to show that two algebraic expressions with one variable are equal. The goal is to see the same value two different ways before working purely with numbers and symbols.
Students simplify algebraic expressions by combining like terms and following the correct order of operations. Terms can include positive or negative fractions or decimals, but the variable stays to the first power.
Students substitute numbers into an expression with variables, then calculate the result using the correct order of operations. Exponents, square roots of perfect squares, brackets, and absolute value bars may appear in the expressions.
Students solve equations that take two steps to crack, like finding an unknown price after a discount and tax. They also set up those equations from word problems before solving them.
Students use drawings, algebra tiles, or balance diagrams to set up and solve equations that take two steps to crack, like finding an unknown number when it has been multiplied and then added to something.
Students solve two-step equations like 3x + 4 = 19 by applying properties of equality, working through two operations in order to find the value of the unknown. Coefficients and numbers in these equations can be fractions or decimals.
Students solve a two-step equation, then plug the answer back in to check that both sides still balance. It's the step that shows the answer is actually correct.
Students read a word problem and translate it into an equation like 2x + 5 = 19. The equation has one unknown and takes two steps to solve.
Students read an equation like 2x + 5 = 19 and write a real-world word problem that fits it, such as a story about earning money or buying items.
Students read a word problem and set up an equation they solve in exactly two steps, such as finding a starting balance after weekly charges are subtracted over several weeks.
Students write and solve inequalities like 2x + 3 < 11, finding all the values of a variable that make the statement true. Problems come from real situations, so students practice setting up the inequality themselves before solving it.
Students solve inequalities like 2x + 3 > 11 by adding, subtracting, multiplying, or dividing both sides, following the same rules as equations but flipping the inequality sign when dividing by a negative number.
When solving an inequality, multiplying or dividing both sides by a negative number flips the direction of the inequality sign. Students investigate why this rule works and explain what it means for the set of numbers that makes the inequality true.
Students solve a one- or two-step inequality and show the answer two ways: as an algebraic statement and as a shaded arrow on a number line.
Students read a word problem and turn it into an inequality, using a variable to stand in for the unknown number and a symbol like < or > to show the relationship between two amounts.
Given an inequality like 2x + 3 > 11, students write a real-world word problem that fits it. They work backward from the math to invent a situation where the inequality describes something meaningful, like a spending limit or a minimum score.
Students use inequalities to solve real-world problems, like finding how many hours to work to earn at least a certain amount, or how many items fit within a budget.
Given an inequality like x + 3 > 10, students find a number that makes it true and explain why it fits the solution. The focus is on checking whether a specific value works, not solving from scratch.
Students compare solving an inequality to solving an equation, explaining what stays the same and what changes, especially how the answer becomes a range of numbers instead of a single value.
| Standard | Definition | Code |
|---|---|---|
| The student will investigate and analyze proportional relationships between… | Students examine how two quantities grow together at a steady rate, moving between word problems, tables, equations, and graphs to describe the same relationship four different ways. | 7.PFA.1 |
| Determine the slope, m, as the rate of change in a proportional relationship… | Students find the rate of change between two related quantities, then write an equation in the form y = mx to match it. The slope m can be positive or negative depending on whether the relationship is growing or shrinking. | 7.PFA.1.a |
| Identify and describe a line with a slope that is positive, negative | Students look at a line on a graph and describe which direction it runs: slanting up, slanting down, or perfectly flat. | 7.PFA.1.b |
| Graph a line representing a proportional relationship, between two quantities… | Students plot a straight line on a graph when they know one point and how steeply the line rises or falls. The steepness (slope) can go upward or downward and shows how two quantities change together at a steady rate. | 7.PFA.1.c |
| Graph a line representing a proportional relationship between two quantities… | Students plot a straight line on a graph using an equation like y = 3x, where the number multiplied by x controls how steeply the line rises or falls. Positive slopes go upward left to right; negative slopes go downward. | 7.PFA.1.d |
| Make connections between and among representations of a proportional… | Students connect different ways of showing the same proportional relationship: a table of values, an equation like y = mx, and a graph. Given one representation, they explain what it looks like in the others. | 7.PFA.1.e |
| The student will simplify numerical expressions, simplify and generate… | Students simplify math expressions like 3x + 2x into 5x, swap in a number for the variable, and find the result. The work builds the algebra skills students use throughout middle and high school math. | 7.PFA.2 |
| Use the order of operations and apply the properties of real numbers to… | Students follow the correct sequence of steps to simplify math expressions that include exponents, brackets, and absolute values. Bases are positive whole numbers and exponents go up to 4. | 7.PFA.2.a |
| Represent equivalent algebraic expressions in one variable using concrete… | Students use hands-on tools like colored chips or tiles to show that two algebraic expressions with one variable are equal. The goal is to see the same value two different ways before working purely with numbers and symbols. | 7.PFA.2.b |
| Simplify and generate equivalent algebraic expressions in one variable by… | Students simplify algebraic expressions by combining like terms and following the correct order of operations. Terms can include positive or negative fractions or decimals, but the variable stays to the first power. | 7.PFA.2.c |
| Use the order of operations and apply the properties of real numbers to… | Students substitute numbers into an expression with variables, then calculate the result using the correct order of operations. Exponents, square roots of perfect squares, brackets, and absolute value bars may appear in the expressions. | 7.PFA.2.d |
| The student will write and solve two-step linear equations in one variable… | Students solve equations that take two steps to crack, like finding an unknown price after a discount and tax. They also set up those equations from word problems before solving them. | 7.PFA.3 |
| Represent and solve two-step linear equations in one variable using a variety… | Students use drawings, algebra tiles, or balance diagrams to set up and solve equations that take two steps to crack, like finding an unknown number when it has been multiplied and then added to something. | 7.PFA.3.a |
| Apply properties of real numbers and properties of equality to solve two-step… | Students solve two-step equations like 3x + 4 = 19 by applying properties of equality, working through two operations in order to find the value of the unknown. Coefficients and numbers in these equations can be fractions or decimals. | 7.PFA.3.b |
| Confirm algebraic solutions to linear equations in one variable | Students solve a two-step equation, then plug the answer back in to check that both sides still balance. It's the step that shows the answer is actually correct. | 7.PFA.3.c |
| Write a two-step linear equation in one variable to represent a verbal… | Students read a word problem and translate it into an equation like 2x + 5 = 19. The equation has one unknown and takes two steps to solve. | 7.PFA.3.d |
| Create a verbal situation in context given a two-step linear equation in one… | Students read an equation like 2x + 5 = 19 and write a real-world word problem that fits it, such as a story about earning money or buying items. | 7.PFA.3.e |
| Solve problems in context that require the solution of a two-step linear… | Students read a word problem and set up an equation they solve in exactly two steps, such as finding a starting balance after weekly charges are subtracted over several weeks. | 7.PFA.3.f |
| The student will write and solve one- and two-step linear inequalities in one… | Students write and solve inequalities like 2x + 3 < 11, finding all the values of a variable that make the statement true. Problems come from real situations, so students practice setting up the inequality themselves before solving it. | 7.PFA.4 |
| Apply properties of real numbers and the addition, subtraction, multiplication | Students solve inequalities like 2x + 3 > 11 by adding, subtracting, multiplying, or dividing both sides, following the same rules as equations but flipping the inequality sign when dividing by a negative number. | 7.PFA.4.a |
| Investigate and explain how the solution set of a linear inequality is affected… | When solving an inequality, multiplying or dividing both sides by a negative number flips the direction of the inequality sign. Students investigate why this rule works and explain what it means for the set of numbers that makes the inequality true. | 7.PFA.4.b |
| Represent solutions to one- or two-step linear inequalities in one variable… | Students solve a one- or two-step inequality and show the answer two ways: as an algebraic statement and as a shaded arrow on a number line. | 7.PFA.4.c |
| Write one- or two-step linear inequalities in one variable to represent a… | Students read a word problem and turn it into an inequality, using a variable to stand in for the unknown number and a symbol like < or > to show the relationship between two amounts. | 7.PFA.4.d |
| Create a verbal situation in context given a one or two-step linear inequality… | Given an inequality like 2x + 3 > 11, students write a real-world word problem that fits it. They work backward from the math to invent a situation where the inequality describes something meaningful, like a spending limit or a minimum score. | 7.PFA.4.e |
| Solve problems in context that require the solution of a one- or two-step… | Students use inequalities to solve real-world problems, like finding how many hours to work to earn at least a certain amount, or how many items fit within a budget. | 7.PFA.4.f |
| Identify a numerical value | Given an inequality like x + 3 > 10, students find a number that makes it true and explain why it fits the solution. The focus is on checking whether a specific value works, not solving from scratch. | 7.PFA.4.g |
| Describe the differences and similarities between solving linear inequalities… | Students compare solving an inequality to solving an equation, explaining what stays the same and what changes, especially how the answer becomes a range of numbers instead of a single value. | 7.PFA.4.h |
Standards of Learning mathematics assessment for grades 3 through 8.
Shorter computer-adaptive mathematics growth assessments for grades 3 through 8, administered during the school year in addition to spring SOL tests.
Alternate assessment program for eligible students with significant cognitive disabilities, covering state-tested grades and subjects.
Students work with positive and negative numbers, fractions, decimals, and percents in real problems. They solve two-step equations and inequalities, work with proportions and scale, find volume and surface area, and start graphing lines through the origin. Probability and reading histograms also come in.
Pull math out of everyday life. Ask how much a tip is on a restaurant bill, how a recipe doubles, what a sale price comes to after a percent off, or how long a trip takes at a steady speed. These short conversations build the proportional thinking students lean on all year.
Most struggles come from shaky basics, not from this year's work. Practice comparing fractions on a number line, finding half and a quarter of common amounts, and switching between fractions, decimals, and percents for the same value, such as 0.75, three quarters, and 75 percent.
A proportional relationship is one where two amounts grow at a steady rate, like miles per hour or price per pound. Students see it in tables, equations like y equals mx, and straight-line graphs through zero. It shows up in scale drawings, unit conversions, percent problems, and slope.
Build from ratio tables and unit rates early, then move to writing and solving proportions, then connect those to y equals mx graphs and slope. Scale drawings, similar figures, and dilations all sit on the same foundation, so revisiting proportional thinking inside each unit pays off.
Operations with negative rationals, distributing and combining like terms, and the inequality sign flip when multiplying or dividing by a negative are common sticking points. Build in short retrieval practice on these throughout the year rather than treating them as one-and-done lessons.
Both use the same moves to isolate the variable, but inequalities have a solution set instead of a single answer, and the symbol flips when both sides are multiplied or divided by a negative. Showing solutions on a number line helps students see that difference.
By June, students should solve two-step equations and inequalities with rational numbers, set up and solve proportions in context, find volume and surface area of boxes and cylinders, and graph a line from y equals mx. They should also explain their reasoning, not just get an answer.