Atoms, molecules, and the periodic table
Students start the year looking at what everything is made of. They build models of tiny particles called atoms and learn how the periodic table sorts the basic building blocks of matter.
This is the year science zooms out to systems. Students trace how energy and matter move through food chains, how sunlight feeds plants, and how a meal gets rearranged inside the body. They also build models of the sun, Earth, and moon to explain phases, eclipses, and seasons, and study how air and oceans shape weather. By spring, they can explain why a forest, a wave, or a season behaves the way it does, using evidence from data they collected.
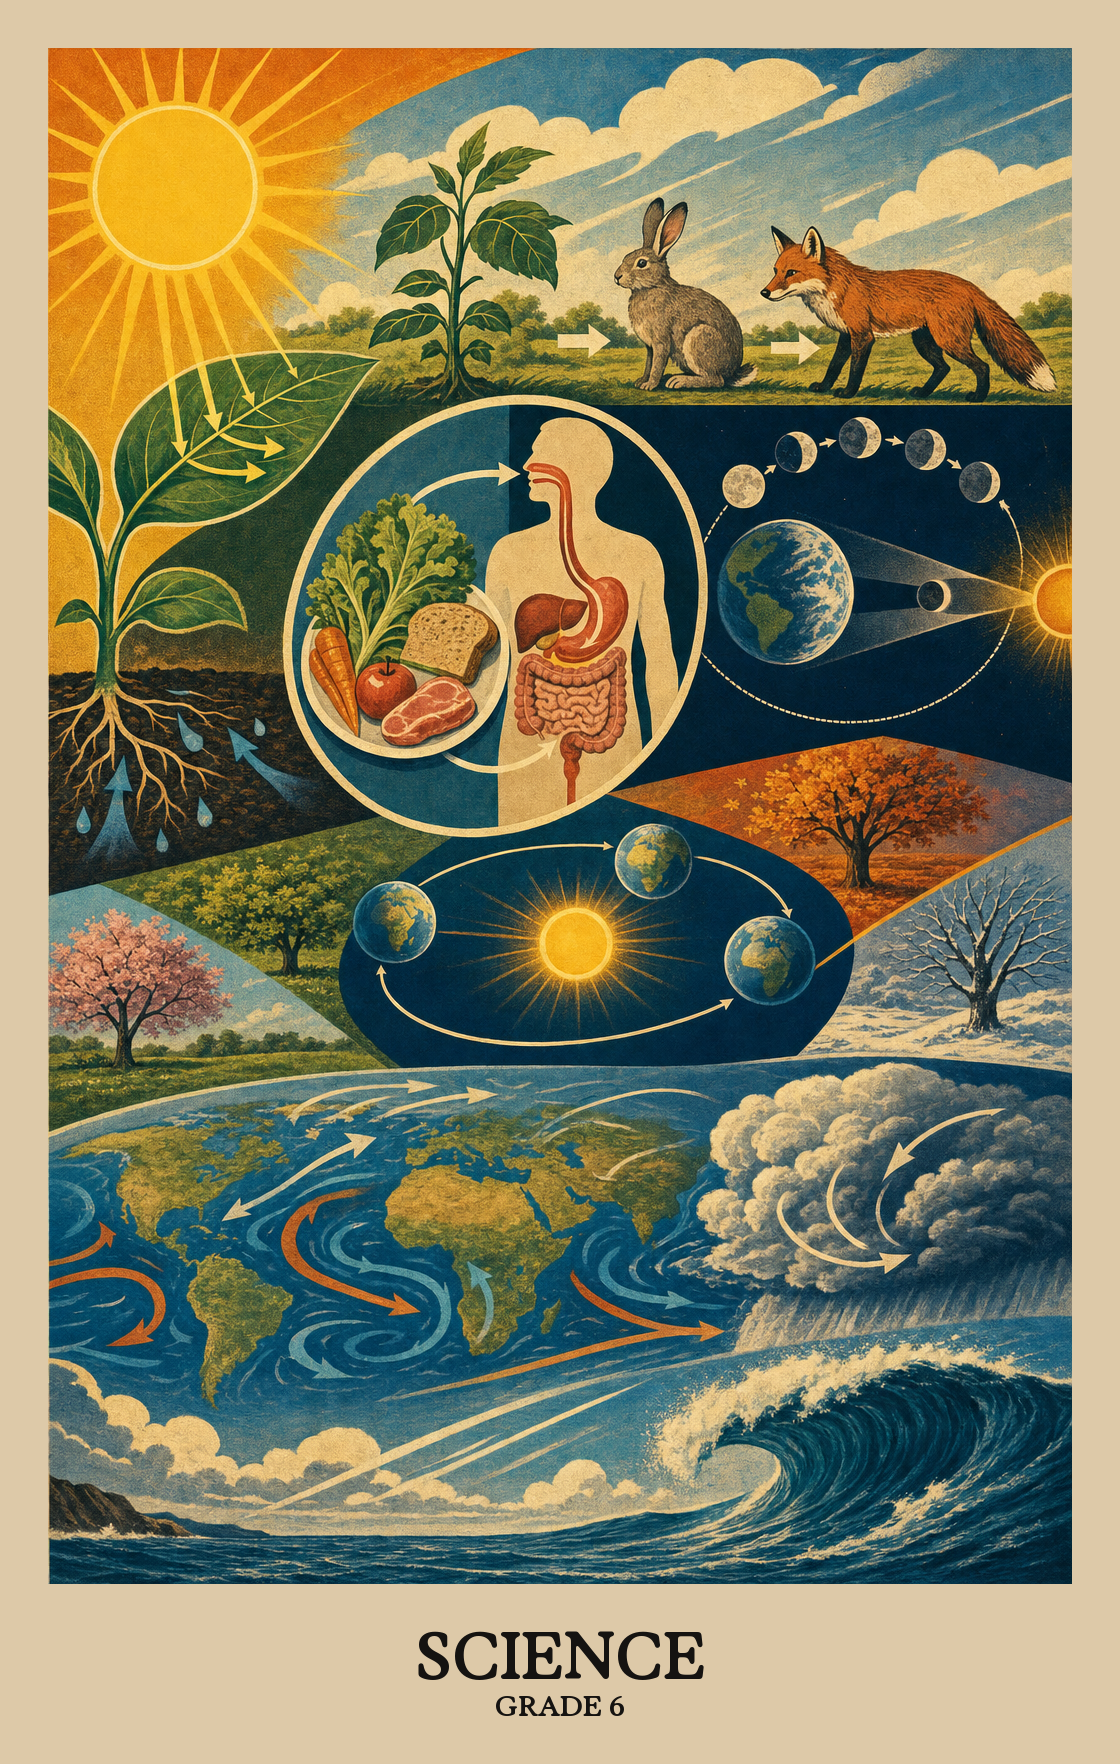
Students start the year looking at what everything is made of. They build models of tiny particles called atoms and learn how the periodic table sorts the basic building blocks of matter.
Students explore how waves carry energy through water, air, and solid materials. They compare how a bigger wave carries more energy and look at why digital signals send clearer information than older analog ones.
Students study how plants, animals, and their surroundings depend on each other. They track how plants use sunlight to make food and how energy and matter move from one living thing to the next.
Students look at what happens when something in an ecosystem shifts, such as a drought or a new species. They use data to argue how populations grow, shrink, or move, and they weigh ideas for protecting wildlife.
Students model why the moon changes shape, why seasons come and go, and what holds the planets in place. They compare the sizes and distances of objects in space to get a feel for how big the solar system really is.
Students finish the year tracking air masses, storms, and long-term climate patterns. They also take on a design problem, setting clear rules for a good solution and testing ideas to see which one works best.
Atoms are the tiny building blocks of everything around us. Students learn how atoms link together to form molecules, like two hydrogen atoms joining one oxygen atom to make water, and they draw or build models to show how that works.
Students use the periodic table to look up elements by name, symbol, and basic properties. It works like a reference chart where each box holds the key facts about one element.
Students use numbers and graphs to show how waves work, focusing on one key relationship: a wave with a bigger peak carries more energy. Think of it like sound, a louder noise makes a bigger wave.
Waves (like light or sound) hit a material and one of three things happens: they bounce back, get soaked in, or pass through. Students model and explain which outcome occurs depending on what the material is made of.
Students compare digital and analog signals to explain why digital is the more reliable way to send information. They read scientific and technical sources, then pull that evidence together to back up the claim.
| Standard | Definition | Code |
|---|---|---|
| Develop models to describe the relationship between atoms and molecules | Atoms are the tiny building blocks of everything around us. Students learn how atoms link together to form molecules, like two hydrogen atoms joining one oxygen atom to make water, and they draw or build models to show how that works. | S.6.8 |
| Utilize the periodic table as an informational tool to identify elements | Students use the periodic table to look up elements by name, symbol, and basic properties. It works like a reference chart where each box holds the key facts about one element. | S.6.9 |
| Use mathematical representations to describe a simple model for waves that… | Students use numbers and graphs to show how waves work, focusing on one key relationship: a wave with a bigger peak carries more energy. Think of it like sound, a louder noise makes a bigger wave. | S.6.10 |
| Develop and use a model to describe that waves are reflected, absorbed | Waves (like light or sound) hit a material and one of three things happens: they bounce back, get soaked in, or pass through. Students model and explain which outcome occurs depending on what the material is made of. | S.6.11 |
| Integrate qualitative scientific and technical information to support the claim… | Students compare digital and analog signals to explain why digital is the more reliable way to send information. They read scientific and technical sources, then pull that evidence together to back up the claim. | S.6.12 |
Students explain why similar relationships (predator and prey, parasite and host) show up across very different ecosystems. The focus is on spotting those patterns and predicting what happens when one organism's role changes.
Students compare different real-world plans for protecting wildlife and healthy ecosystems, then decide which plan works best and why.
Photosynthesis is how plants turn sunlight, water, and carbon dioxide into food. Students explain, using evidence, how this process moves energy into living things and cycles matter through an ecosystem.
Food doesn't just disappear inside a body. Students model how the body breaks down food through chemical reactions, rearranging its molecules to build new tissue or release energy the body can use.
When food, water, or space runs short, some organisms survive and others don't. Students look at real data to explain how resource availability shapes which populations grow, shrink, or disappear in an ecosystem.
Students map how matter (like water or carbon) moves in cycles through an ecosystem and how energy flows from the sun through plants, animals, and decomposers. The model shows how living things and their environment depend on each other.
When something in an ecosystem changes, like a drought drying up a pond or a predator disappearing, the populations of plants and animals shift too. Students use real data and observations to explain why.
| Standard | Definition | Code |
|---|---|---|
| Construct an explanation that predicts patterns of interactions among organisms… | Students explain why similar relationships (predator and prey, parasite and host) show up across very different ecosystems. The focus is on spotting those patterns and predicting what happens when one organism's role changes. | S.6.1 |
| Evaluate competing design solutions for maintaining biodiversity and ecosystem… | Students compare different real-world plans for protecting wildlife and healthy ecosystems, then decide which plan works best and why. | S.6.2 |
| Construct a scientific explanation based on evidence for the role of… | Photosynthesis is how plants turn sunlight, water, and carbon dioxide into food. Students explain, using evidence, how this process moves energy into living things and cycles matter through an ecosystem. | S.6.3 |
| Develop a model to describe how food is rearranged through chemical reactions… | Food doesn't just disappear inside a body. Students model how the body breaks down food through chemical reactions, rearranging its molecules to build new tissue or release energy the body can use. | S.6.4 |
| Analyze and interpret data to provide evidence for the effects of resource… | When food, water, or space runs short, some organisms survive and others don't. Students look at real data to explain how resource availability shapes which populations grow, shrink, or disappear in an ecosystem. | S.6.5 |
| Develop a model to describe the cycling of matter and flow of energy among… | Students map how matter (like water or carbon) moves in cycles through an ecosystem and how energy flows from the sun through plants, animals, and decomposers. The model shows how living things and their environment depend on each other. | S.6.6 |
| Construct an argument supported by empirical evidence that changes to physical… | When something in an ecosystem changes, like a drought drying up a pond or a predator disappearing, the populations of plants and animals shift too. Students use real data and observations to explain why. | S.6.7 |
Students build or draw a model of the Earth, sun, and moon to explain why the moon appears to change shape each month, why eclipses happen, and why seasons follow a predictable pattern each year.
Gravity pulls every planet, moon, and star toward other objects with mass. Students model how that invisible pull keeps planets orbiting the sun and holds the rotating arms of a galaxy together.
Students look at real data about the planets, moons, and sun to figure out how their sizes and distances compare. A planet that looks small in a photo might be thousands of times bigger than Earth.
Students track how air masses move and collide to explain why the weather changes. They collect real data, like temperature and pressure readings, to back up what they observe.
Unequal heating from the sun and Earth's rotation push air and ocean water into predictable patterns. Those patterns shape whether a region tends to be rainy, dry, windy, or warm across seasons.
Students examine data and evidence to understand what has caused Earth's average temperature to rise over the last 100 years, then form questions that push toward clearer answers.
Students study data from past earthquakes, floods, and volcanic eruptions to spot patterns. Those patterns help scientists predict when the next event might strike and build better warning systems.
| Standard | Definition | Code |
|---|---|---|
| Develop and use a model of the Earth-sun-moon system to describe the cyclic… | Students build or draw a model of the Earth, sun, and moon to explain why the moon appears to change shape each month, why eclipses happen, and why seasons follow a predictable pattern each year. | S.6.13 |
| Develop and use a model to describe the role of gravity in the motions within… | Gravity pulls every planet, moon, and star toward other objects with mass. Students model how that invisible pull keeps planets orbiting the sun and holds the rotating arms of a galaxy together. | S.6.14 |
| Analyze and interpret data to determine scale properties of objects in the… | Students look at real data about the planets, moons, and sun to figure out how their sizes and distances compare. A planet that looks small in a photo might be thousands of times bigger than Earth. | S.6.15 |
| Collect data to provide evidence for how the motions and complex interactions… | Students track how air masses move and collide to explain why the weather changes. They collect real data, like temperature and pressure readings, to back up what they observe. | S.6.16 |
| Develop and use a model to describe how unequal heating and rotation of the… | Unequal heating from the sun and Earth's rotation push air and ocean water into predictable patterns. Those patterns shape whether a region tends to be rainy, dry, windy, or warm across seasons. | S.6.17 |
| Ask questions to clarify evidence of the factors that have caused the change in… | Students examine data and evidence to understand what has caused Earth's average temperature to rise over the last 100 years, then form questions that push toward clearer answers. | S.6.18 |
| analyze and interpret data on natural hazards to forecast future catastrophic… | Students study data from past earthquakes, floods, and volcanic eruptions to spot patterns. Those patterns help scientists predict when the next event might strike and build better warning systems. | S.6.19 |
Students figure out exactly what a solution must do and what limits it must work within, like a budget, available materials, or a size requirement, before any building or testing begins.
Students test multiple solutions to the same problem, then compare the results to find which parts of each design worked best.
| Standard | Definition | Code |
|---|---|---|
| Define the criteria and constraints of a design problem with sufficient… | Students figure out exactly what a solution must do and what limits it must work within, like a budget, available materials, or a size requirement, before any building or testing begins. | EDS.6.20 |
| Analyze data from tests to determine similarities and differences among several… | Students test multiple solutions to the same problem, then compare the results to find which parts of each design worked best. | EDS.6.21 |
Dynamic Learning Maps alternate assessment for eligible students with significant cognitive disabilities, covering the same tested subjects as the general summative program.
Students study living things, matter and waves, and the Earth, sun, and moon. They build models, run small experiments, and use data to back up what they say. A lot of the work is explaining why something happens, not just naming it.
Ask students to explain what they learned using a quick sketch or a model made from things on the kitchen table. Watching the moon for a week, tracking the weather, or talking about what plants need are short habits that build real understanding.
No. Students learn to read the periodic table as a reference, not memorize it. They should be able to find an element, see its symbol and number, and understand that everything around them is built from these basic pieces.
Many teachers open with ecosystems and energy flow in the fall, move into matter, atoms, and waves in winter, and finish with Earth, weather, and space in spring. Engineering practices fit into each unit rather than living in their own block.
Cycling of matter and flow of energy give students the most trouble, especially photosynthesis and food webs. Moon phases and seasons also come back several times before they stick. Plan to revisit these with new models rather than reteach them the same way.
A model is a drawing, diagram, or simple build that shows how something works, like a sketch of the water cycle or a bead diagram of a molecule. Students use models to test their thinking and revise them as they learn more.
By spring, students should explain a phenomenon using evidence, build and revise a model, and read a simple data table or graph to support a claim. If they can talk through why an eclipse happens or why a population shrinks, they are ready.
Students use ratios, scale, and simple graphs, especially when comparing planets, measuring waves, or looking at population data. The math is grade-level arithmetic in a science setting. Reading a graph and noticing a pattern matters more than heavy calculation.
Pick one thing outside and track it for a week: the moon, the weather, a plant, or a bird feeder. Have students write or sketch what they notice and one question it raises. That single habit builds the observation skills the whole year leans on.