Whole numbers, fractions, and decimals
Students sharpen the arithmetic they will lean on all year. They add, subtract, multiply, and divide fractions and multi-digit decimals, and they use those skills in everyday word problems.
Sixth grade is when math stretches past whole numbers into the full number line, with negatives, fractions, decimals, and percents all working together. Students learn to think in ratios and unit rates, the kind of math behind sale prices and miles per hour. Letters start standing in for unknown numbers, so students write and solve simple equations. By spring, they can find a percent of a number, plot points in all four quadrants of a grid, and solve a one-step equation like x plus 7 equals 12.
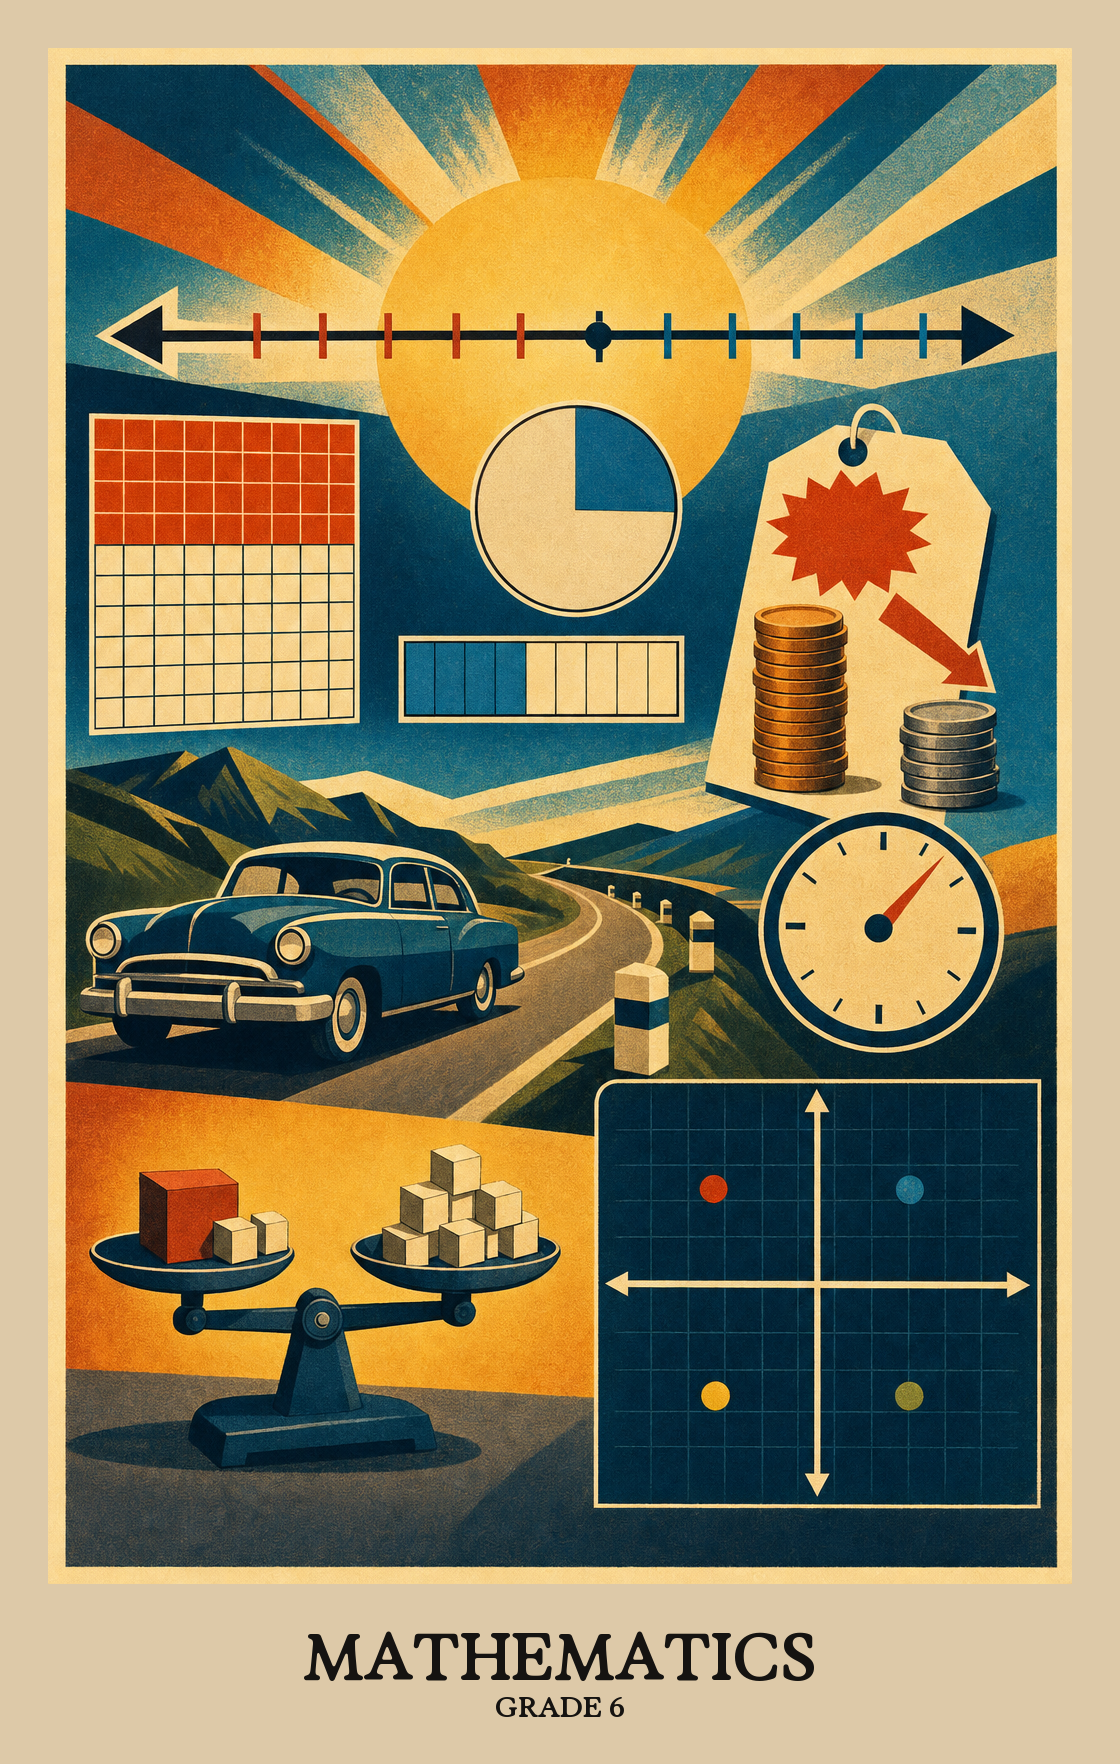
Students sharpen the arithmetic they will lean on all year. They add, subtract, multiply, and divide fractions and multi-digit decimals, and they use those skills in everyday word problems.
Students learn to compare quantities using ratios and unit rates. They work with prices, speeds, and percents, and they convert between units like inches and feet or grams and kilograms.
Students extend the number line below zero and place positive and negative numbers in order. They plot points in all four quadrants of a grid and find distances between them.
Students start using letters to stand for numbers. They write and simplify expressions with exponents and variables, and they solve one-step equations and inequalities tied to real situations.
Students find the area of triangles and other polygons by breaking them into familiar shapes. They use nets to find surface area and calculate the volume of boxes with fractional side lengths.
Students collect data and display it in dot plots, histograms, box plots, and bar graphs. They describe the shape of a data set and use mean, median, and range to draw conclusions.
Students keep working through math problems even when the solution isn't obvious. They ask for help when stuck, use feedback to improve, and track their own progress over time.
Students read a math problem carefully, figure out what it's actually asking, and keep trying even when the first approach doesn't work. Hitting a wall is part of the process.
Students take a real math problem and translate it back and forth between numbers and what those numbers mean in the world. They check that their answer still makes sense as a real quantity, not just a calculation result.
Students build a math argument that shows why their answer makes sense, then explain where a classmate's reasoning goes wrong or holds up.
Students use drawings, tables, graphs, or equations to represent a real-world problem and check whether the answer makes sense.
Students choose the right tool for the job, whether that means picking up a ruler, a calculator, graph paper, or even a sketch. Knowing which tool fits the problem is part of solving it.
Students check their work carefully, use exact numbers and units, and say what they mean clearly. In math, a small mistake in a label or calculation can change the whole answer.
Students notice patterns and shortcuts hiding inside a problem, like seeing that a fraction, an equation, or a shape has a predictable structure they can use instead of starting from scratch each time.
Students notice when the same steps keep showing up in a problem and use that pattern to find a shortcut or rule. Spotting the shortcut saves time and builds a habit of thinking that works across math topics.
| Standard | Definition | Code |
|---|---|---|
| Display perseverance and patience in problem-solving | Students keep working through math problems even when the solution isn't obvious. They ask for help when stuck, use feedback to improve, and track their own progress over time. | 6.MP |
| Make sense of problems and persevere in solving them | Students read a math problem carefully, figure out what it's actually asking, and keep trying even when the first approach doesn't work. Hitting a wall is part of the process. | 6.MP.1 |
| Reason abstractly and quantitatively | Students take a real math problem and translate it back and forth between numbers and what those numbers mean in the world. They check that their answer still makes sense as a real quantity, not just a calculation result. | 6.MP.2 |
| Construct viable arguments and critique the reasoning of others | Students build a math argument that shows why their answer makes sense, then explain where a classmate's reasoning goes wrong or holds up. | 6.MP.3 |
| Model with mathematics | Students use drawings, tables, graphs, or equations to represent a real-world problem and check whether the answer makes sense. | 6.MP.4 |
| Use appropriate tools strategically | Students choose the right tool for the job, whether that means picking up a ruler, a calculator, graph paper, or even a sketch. Knowing which tool fits the problem is part of solving it. | 6.MP.5 |
| Attend to precision | Students check their work carefully, use exact numbers and units, and say what they mean clearly. In math, a small mistake in a label or calculation can change the whole answer. | 6.MP.6 |
| Look for and make use of structure | Students notice patterns and shortcuts hiding inside a problem, like seeing that a fraction, an equation, or a shape has a predictable structure they can use instead of starting from scratch each time. | 6.MP.7 |
| Look for and express regularity in repeated reasoning | Students notice when the same steps keep showing up in a problem and use that pattern to find a shortcut or rule. Spotting the shortcut saves time and builds a habit of thinking that works across math topics. | 6.MP.8 |
Students work with three kinds of numbers: whole numbers and their negatives (like -4 or 7), fractions (like 3/4), and decimals (like 0.6). All three belong to the same family called rational numbers.
Students apply all four operations (adding, subtracting, multiplying, and dividing) to whole numbers, fractions, and decimals. This is the foundation most middle school math builds on.
Students write number sentences using operations like addition, multiplication, or parentheses, then solve them to find the answer. The focus is on setting up the expression correctly before calculating.
Students practice writing simple fractions, like 1/4 or 3/5, as decimals. This builds the habit of moving between the two forms of the same number.
Negative and positive whole numbers, like -10, 0, and 10. Students place them on a number line, compare them, and use them to describe things like temperature below zero or floors below ground.
Students find unit rates by figuring out how much of one thing matches exactly one of another, like cost per item or miles per hour. This skill shows up in shopping, cooking, and most real-world math problems.
Ratios compare two amounts to show how they relate, like 3 cups of flour for every 1 cup of sugar. Students write, read, and use ratios to solve problems involving recipes, speeds, and other real-world comparisons.
Students read graphs and tables that show number data, then describe what's typical, what's spread out, and where any unusual values show up.
Students learn to describe how spread out a set of numbers is, using tools like range and mean absolute deviation. This shows whether data points cluster closely together or scatter far apart.
Absolute value is the distance a number sits from zero on a number line, regardless of direction. Students learn that -6 and 6 are both 6 steps from zero, so both have an absolute value of 6.
Students sort data into categories or measure it with numbers, then read a chart or graph to spot patterns and draw conclusions.
Students find the largest number that divides evenly into two numbers (greatest common factor) and the smallest number both can divide into (least common multiple). These skills show up in simplifying fractions and solving real problems with groups or schedules.
Reading and writing math expressions means translating between words and symbols. Students write phrases like "5 more than a number" as algebra, then check whether two expressions mean the same thing.
Reading and writing algebraic expressions means working with math shorthand like 3x or 2n + 5, where a letter stands in for an unknown number. Students recognize these expressions, build their own, and decide whether one fits a given situation.
Like terms share the same variable, so 3x and 5x are like terms but 3x and 5y are not. Students spot which parts of an expression can be combined before simplifying.
Students write a simple equation or inequality with one unknown, then find the value that makes it true. Think of it as figuring out what number belongs in the blank to balance both sides.
Ratios compare two amounts, like 3 red tiles for every 5 blue tiles. Students use this idea to find rates, such as how far a car travels per hour, and solve problems where two quantities change together.
Ratios compare two quantities, like 3 cups of juice to 2 cups of water. Students find equivalent ratios, convert between ratios and percentages, and calculate unit rates to solve real problems.
Students practice converting measurements within the same system, such as inches to feet or minutes to hours, using ratios and rates to find the right amount.
Students plot points anywhere on a coordinate grid, including the negative sections to the left of zero and below zero. They read and write each point as a pair of numbers showing how far to move sideways and up or down from the center.
Students place fractions, decimals, and negative numbers in the right spot on a number line. This builds a clear picture of how those numbers relate to each other and to zero.
Students plot points on a grid to draw shapes like triangles, rectangles, and other polygons, then use the coordinates to find side lengths and describe the shape's properties.
Students find the length of a side of a shape on a grid by reading its corner points. If two corners share the same row or column, students subtract one coordinate from the other to get the distance.
Students find the area of shapes like triangles, rectangles, and other flat figures. They learn and apply formulas to calculate how much surface each shape covers.
Students find the total area of every face on a 3-D shape, like a box or a pyramid, then add those areas together. It's the amount of wrapping paper needed to cover the outside of the shape.
Students find the volume of box-shaped figures even when the side lengths include fractions. They multiply length, width, and height to get the answer, working with numbers like 2½ or ¾ inches.
| Standard | Definition | Code |
|---|---|---|
| Rational numbers as a concept<ul><li>Integers</li><li>Fractions</li><li>Decimal… | Students work with three kinds of numbers: whole numbers and their negatives (like -4 or 7), fractions (like 3/4), and decimals (like 0.6). All three belong to the same family called rational numbers. | 6.LP5.1.1 |
| All operations with whole numbers, fractions | Students apply all four operations (adding, subtracting, multiplying, and dividing) to whole numbers, fractions, and decimals. This is the foundation most middle school math builds on. | 6.LP5.2.1 |
| Write & evaluate numerical expressions | Students write number sentences using operations like addition, multiplication, or parentheses, then solve them to find the answer. The focus is on setting up the expression correctly before calculating. | 6.LP5.2.2 |
| Convert fractions with denominators of 2, 4, 5 and 10 to the decimal notation | Students practice writing simple fractions, like 1/4 or 3/5, as decimals. This builds the habit of moving between the two forms of the same number. | 6.LP5.2.3 |
| Integers | Negative and positive whole numbers, like -10, 0, and 10. Students place them on a number line, compare them, and use them to describe things like temperature below zero or floors below ground. | 6.LP5.3.1 |
| Unit rates | Students find unit rates by figuring out how much of one thing matches exactly one of another, like cost per item or miles per hour. This skill shows up in shopping, cooking, and most real-world math problems. | 6.LP5.3.2 |
| Ratios | Ratios compare two amounts to show how they relate, like 3 cups of flour for every 1 cup of sugar. Students write, read, and use ratios to solve problems involving recipes, speeds, and other real-world comparisons. | 6.LP5.3.3 |
| Numerical data distributions | Students read graphs and tables that show number data, then describe what's typical, what's spread out, and where any unusual values show up. | 6.LP5.3.4 |
| Measures of variation | Students learn to describe how spread out a set of numbers is, using tools like range and mean absolute deviation. This shows whether data points cluster closely together or scatter far apart. | 6.LP5.3.5 |
| Absolute value | Absolute value is the distance a number sits from zero on a number line, regardless of direction. Students learn that -6 and 6 are both 6 steps from zero, so both have an absolute value of 6. | 6.LP5.3.6 |
| Display and analyze categorical and quantitative | Students sort data into categories or measure it with numbers, then read a chart or graph to spot patterns and draw conclusions. | 6.LP5.3.7 |
| Greatest common factor & least common multiple | Students find the largest number that divides evenly into two numbers (greatest common factor) and the smallest number both can divide into (least common multiple). These skills show up in simplifying fractions and solving real problems with groups or schedules. | 6.LP6.1.1 |
| Write, analyze, and evaluate numerical and algebraic expressions | Reading and writing math expressions means translating between words and symbols. Students write phrases like "5 more than a number" as algebra, then check whether two expressions mean the same thing. | 6.LP6.2.1 |
| Identify, generate, and evaluate algebraic expressions | Reading and writing algebraic expressions means working with math shorthand like 3x or 2n + 5, where a letter stands in for an unknown number. Students recognize these expressions, build their own, and decide whether one fits a given situation. | 6.LP6.2.2 |
| Identify like terms in an algebraic expression | Like terms share the same variable, so 3x and 5x are like terms but 3x and 5y are not. Students spot which parts of an expression can be combined before simplifying. | 6.LP6.2.3 |
| Write and solve one-step equations & inequalities | Students write a simple equation or inequality with one unknown, then find the value that makes it true. Think of it as figuring out what number belongs in the blank to balance both sides. | 6.LP6.3.1 |
| Concept of ratio and rate | Ratios compare two amounts, like 3 red tiles for every 5 blue tiles. Students use this idea to find rates, such as how far a car travels per hour, and solve problems where two quantities change together. | 6.LP6.4.1 |
| Equivalent ratios, percentages, unit rates | Ratios compare two quantities, like 3 cups of juice to 2 cups of water. Students find equivalent ratios, convert between ratios and percentages, and calculate unit rates to solve real problems. | 6.LP6.4.2 |
| Convert within measurement systems | Students practice converting measurements within the same system, such as inches to feet or minutes to hours, using ratios and rates to find the right amount. | 6.LP6.4.3 |
| Plot order pairs in all four quadrants | Students plot points anywhere on a coordinate grid, including the negative sections to the left of zero and below zero. They read and write each point as a pair of numbers showing how far to move sideways and up or down from the center. | 6.LP6.6.1 |
| Show rational numbers on a number line | Students place fractions, decimals, and negative numbers in the right spot on a number line. This builds a clear picture of how those numbers relate to each other and to zero. | 6.LP6.6.2 |
| Draw polygons on a coordinate grid | Students plot points on a grid to draw shapes like triangles, rectangles, and other polygons, then use the coordinates to find side lengths and describe the shape's properties. | 6.LP6.6.3 |
| Find the side length of a polygon graphed on the coordinate plane | Students find the length of a side of a shape on a grid by reading its corner points. If two corners share the same row or column, students subtract one coordinate from the other to get the distance. | 6.LP6.6.4 |
| Area of triangles, quadrilaterals | Students find the area of shapes like triangles, rectangles, and other flat figures. They learn and apply formulas to calculate how much surface each shape covers. | 6.LP8.2.1 |
| Surface area | Students find the total area of every face on a 3-D shape, like a box or a pyramid, then add those areas together. It's the amount of wrapping paper needed to cover the outside of the shape. | 6.LP8.2.2 |
| Volume of right rectangular prisms with fractional edge lengths | Students find the volume of box-shaped figures even when the side lengths include fractions. They multiply length, width, and height to get the answer, working with numbers like 2½ or ¾ inches. | 6.LP8.2.3 |
Students add, subtract, multiply, and divide whole numbers, fractions, and decimals to solve real math problems. The work covers the kinds of calculations that come up in everyday situations, not just textbook exercises.
Students add and subtract fractions with unlike denominators, including mixed numbers, to solve real problems. This is the fraction arithmetic that shows up in cooking, measurement, and everyday math from here on out.
Students multiply and divide whole numbers, fractions, and mixed numbers, choosing whatever method makes sense to them. They also explain what the answer means in a real-world problem.
Students add, subtract, multiply, and divide decimal numbers like 3.75 or 12.4 with confidence, choosing a method that makes sense to them, whether that is sketching a model or working through the numbers on paper.
Students solve real-world math problems using whole numbers, fractions, and decimals. That means adding, subtracting, multiplying, and dividing across all three number types, not just in isolation.
Students find the mean by adding up all the values in a data set and dividing by how many values there are. It shows what each value would be if the total were split equally among every item in the group.
Students learn to display data visually, choosing the right chart for the job. Dot plots, histograms, box plots, and bar graphs each tell a different story about a set of numbers or categories.
Students read a set of numbers from a real survey or experiment, then describe what's typical, how spread out the values are, and whether the data clusters or trails off in any direction.
Students design a simple experiment, collect the results, and find the middle value or average to summarize what they found. Then they use those numbers to spot patterns, compare two sets of data, and make a prediction about what might happen next.
Students learn when to use the mean, median, or range to summarize a set of numbers based on how the data is spread out and what the numbers actually represent.
Students learn what happens to the average and the middle value of a set of numbers when one number is added or removed. They show the change on a dot plot or box plot.
Students work with positive and negative whole numbers to solve real problems, then place values like fractions and decimals on a number line to show where they fall.
Students place positive and negative whole numbers on a number line and explain what zero means in context, like zero degrees being neither hot nor cold, or zero dollars meaning no money owed.
Students place positive and negative whole numbers on a number line and compare their distance from zero to see why opposites like 3 and negative 3 mirror each other.
Negative numbers sit on the left side of zero on a number line, and positive numbers sit on the right. Students also learn that flipping a number's sign twice lands you back where you started.
Students compare positive and negative numbers, fractions, and decimals, then use symbols like < and > to show which is greater. They explain what that order means in a real situation, like ranking temperatures or comparing debts.
Absolute value is how far a number sits from zero, whether it falls to the left or right on the number line. Students use that distance to make sense of real situations, like how far below sea level a point is or how far above a starting balance an account has grown.
Absolute value measures how far a number sits from zero, not whether it is bigger or smaller than another number. Students learn to keep those two ideas separate: distance from zero is not the same as which number comes first on a number line.
Students use ratios and percentages to solve real-world problems, like figuring out a sale price, converting miles to kilometers, or comparing speeds. The math involves scaling numbers up or down to find an unknown value.
Students compare two quantities and describe how they relate to each other, like saying a recipe uses 2 cups of flour for every 1 cup of sugar. Ratios show up in cooking, sports stats, and maps.
Students build a table of two amounts that stay in the same ratio, fill in any missing numbers, and then plot those pairs as points on a graph. They also use the table to compare two different ratios side by side.
Students pick their own method to solve proportion problems, such as finding how many cups of flour are needed when doubling a recipe or how far a car travels at a steady speed. The strategy is their choice; the answer has to hold up.
A rate compares two different quantities, like miles per hour or dollars per item. Students explain what a unit rate is and how it fits into a ratio relationship.
Students find the price of one item or the speed of one unit of time, then use that single rate to solve everyday problems like comparing grocery prices or calculating travel time.
Students find what a percent means in real life, like calculating a 20% tip, a sale discount, or a test score out of 100. They work backward too, finding the original price or the missing amount when only the percent is known.
Students use ratios to convert between units, such as inches to feet or kilometers to miles, to solve real-world problems. They work within both the customary and metric systems.
| Standard | Definition | Code |
|---|---|---|
| Solve relevant, mathematical problems involving operations with whole numbers… | Students add, subtract, multiply, and divide whole numbers, fractions, and decimals to solve real math problems. The work covers the kinds of calculations that come up in everyday situations, not just textbook exercises. | 6.NR.1 |
| Fluently add and subtract any combination of fractions to solve problems | Students add and subtract fractions with unlike denominators, including mixed numbers, to solve real problems. This is the fraction arithmetic that shows up in cooking, measurement, and everyday math from here on out. | 6.NR.1.1 |
| Multiply and divide any combination of whole numbers, fractions | Students multiply and divide whole numbers, fractions, and mixed numbers, choosing whatever method makes sense to them. They also explain what the answer means in a real-world problem. | 6.NR.1.2 |
| Perform operations with multi-digit decimal numbers fluently using models and… | Students add, subtract, multiply, and divide decimal numbers like 3.75 or 12.4 with confidence, choosing a method that makes sense to them, whether that is sketching a model or working through the numbers on paper. | 6.NR.1.3 |
| Apply operations with whole numbers, fractions and decimals within relevant… | Students solve real-world math problems using whole numbers, fractions, and decimals. That means adding, subtracting, multiplying, and dividing across all three number types, not just in isolation. | 6.NR.2 |
| Describe and interpret the center of the distribution by the equal share value | Students find the mean by adding up all the values in a data set and dividing by how many values there are. It shows what each value would be if the total were split equally among every item in the group. | 6.NR.2.1 |
| Summarize categorical and quantitative | Students learn to display data visually, choosing the right chart for the job. Dot plots, histograms, box plots, and bar graphs each tell a different story about a set of numbers or categories. | 6.NR.2.2 |
| Interpret numerical data to answer a statistical investigative question created | Students read a set of numbers from a real survey or experiment, then describe what's typical, how spread out the values are, and whether the data clusters or trails off in any direction. | 6.NR.2.3 |
| Design simple experiments and collect data | Students design a simple experiment, collect the results, and find the middle value or average to summarize what they found. Then they use those numbers to spot patterns, compare two sets of data, and make a prediction about what might happen next. | 6.NR.2.4 |
| Relate the choice of measures of center and variability to the shape of the… | Students learn when to use the mean, median, or range to summarize a set of numbers based on how the data is spread out and what the numbers actually represent. | 6.NR.2.5 |
| Describe the impact that inserting or deleting a data point has on the mean and… | Students learn what happens to the average and the middle value of a set of numbers when one number is added or removed. They show the change on a dot plot or box plot. | 6.NR.2.6 |
| Solve a variety of problems involving whole numbers and their opposites | Students work with positive and negative whole numbers to solve real problems, then place values like fractions and decimals on a number line to show where they fall. | 6.NR.3 |
| Identify and compare integers and explain the meaning of zero based on multiple… | Students place positive and negative whole numbers on a number line and explain what zero means in context, like zero degrees being neither hot nor cold, or zero dollars meaning no money owed. | 6.NR.3.1 |
| Order and plot integers on a number line and use distance from zero to discover… | Students place positive and negative whole numbers on a number line and compare their distance from zero to see why opposites like 3 and negative 3 mirror each other. | 6.NR.3.2 |
| Recognize and explain that opposite signs of integers indicate locations on… | Negative numbers sit on the left side of zero on a number line, and positive numbers sit on the right. Students also learn that flipping a number's sign twice lands you back where you started. | 6.NR.3.3 |
| Write, interpret, and explain statements of order for rational numbers in… | Students compare positive and negative numbers, fractions, and decimals, then use symbols like < and > to show which is greater. They explain what that order means in a real situation, like ranking temperatures or comparing debts. | 6.NR.3.4 |
| Explain the absolute value of a rational number as its distance from zero on… | Absolute value is how far a number sits from zero, whether it falls to the left or right on the number line. Students use that distance to make sense of real situations, like how far below sea level a point is or how far above a starting balance an account has grown. | 6.NR.3.5 |
| Distinguish comparisons of absolute value from statements about order | Absolute value measures how far a number sits from zero, not whether it is bigger or smaller than another number. Students learn to keep those two ideas separate: distance from zero is not the same as which number comes first on a number line. | 6.NR.3.6 |
| Solve a variety of contextual problems involving ratios, unit rates, equivalent… | Students use ratios and percentages to solve real-world problems, like figuring out a sale price, converting miles to kilometers, or comparing speeds. The math involves scaling numbers up or down to find an unknown value. | 6.NR.4 |
| Explain the concept of a ratio, represent ratios | Students compare two quantities and describe how they relate to each other, like saying a recipe uses 2 cups of flour for every 1 cup of sugar. Ratios show up in cooking, sports stats, and maps. | 6.NR.4.1 |
| Make tables of equivalent ratios relating quantities with whole-number… | Students build a table of two amounts that stay in the same ratio, fill in any missing numbers, and then plot those pairs as points on a graph. They also use the table to compare two different ratios side by side. | 6.NR.4.2 |
| Solve problems involving proportions using a variety of student-selected… | Students pick their own method to solve proportion problems, such as finding how many cups of flour are needed when doubling a recipe or how far a car travels at a steady speed. The strategy is their choice; the answer has to hold up. | 6.NR.4.3 |
| Describe the concept of rates and unit rate in the context of a ratio… | A rate compares two different quantities, like miles per hour or dollars per item. Students explain what a unit rate is and how it fits into a ratio relationship. | 6.NR.4.4 |
| Solve unit rate problems including those involving unit pricing and constant… | Students find the price of one item or the speed of one unit of time, then use that single rate to solve everyday problems like comparing grocery prices or calculating travel time. | 6.NR.4.5 |
| Calculate a percent of a quantity as a rate per 100 and solve everyday problems… | Students find what a percent means in real life, like calculating a 20% tip, a sale discount, or a test score out of 100. They work backward too, finding the original price or the missing amount when only the percent is known. | 6.NR.4.6 |
| Use ratios to convert within measurement systems | Students use ratios to convert between units, such as inches to feet or kilometers to miles, to solve real-world problems. They work within both the customary and metric systems. | 6.NR.4.7 |
Students find the area of flat shapes, the surface area of 3-D objects like boxes and prisms, and the volume of those same objects. They apply those calculations to real problems, not just textbook exercises.
Students find the area of triangles and four-sided shapes by breaking them apart into simpler pieces, like rectangles and triangles, then adding those pieces together. They use that process to solve real problems.
Students find the total outside surface of a box or triangular prism by unfolding its faces into a flat pattern, then adding up the area of each face.
Students find the volume of a box-shaped object when its length, width, or height includes a fraction. They multiply the area of the bottom face by the height using the standard volume formula.
| Standard | Definition | Code |
|---|---|---|
| Solve relevant problems involving area, surface area | Students find the area of flat shapes, the surface area of 3-D objects like boxes and prisms, and the volume of those same objects. They apply those calculations to real problems, not just textbook exercises. | 6.GSR.5 |
| Explore area as a measurable attribute of triangles, quadrilaterals | Students find the area of triangles and four-sided shapes by breaking them apart into simpler pieces, like rectangles and triangles, then adding those pieces together. They use that process to solve real problems. | 6.GSR.5.1 |
| Given the net of three-dimensional figures with rectangular and triangular… | Students find the total outside surface of a box or triangular prism by unfolding its faces into a flat pattern, then adding up the area of each face. | 6.GSR.5.2 |
| Calculate the volume of right rectangular prisms with fractional edge lengths… | Students find the volume of a box-shaped object when its length, width, or height includes a fraction. They multiply the area of the bottom face by the height using the standard volume formula. | 6.GSR.5.3 |
Students read and write expressions like 3x + 5, plug in numbers to find the value, and explain what the expression means in a real situation, such as the total cost of buying several items at a fixed price.
Exponents are a shorthand way to write repeated multiplication. Students learn to write and solve expressions like 2 to the 4th power or (1/2) squared, using whole-number exponents with positive, negative, and fractional bases.
Students find the largest number that divides evenly into two numbers and the smallest number both can divide into. These skills help solve real problems like splitting things into equal groups or finding when two events land on the same day.
Students write and read math expressions like 3x + 5 to describe real situations, such as a starting amount plus equal groups added on. They translate between the written words and the symbolic shorthand.
Students substitute a number for each variable in an expression and calculate the result. For example, if a problem uses the expression 5x + 3, and x = 4, students find the answer by working through the arithmetic.
Students use rules like the distributive property to rewrite math expressions in different forms that mean the same thing. Rearranging or regrouping numbers and variables helps confirm two expressions are equal.
Students write a simple equation or inequality to model a real situation, like figuring out how many items fit in a budget, then solve it. One operation is all it takes.
Students plug a number into a simple equation or inequality (like x + 4 = 10) to check whether it makes the statement true or false. They practice this with both equations and inequalities using values they are given.
Students write a simple equation or inequality to solve a real problem, like figuring out how many items fit in a box given a limit. They also learn that a letter in math can stand for one missing number or a whole range of numbers.
Students write simple equations to solve real problems, then find the missing number. This covers equations like x + 5 = 12, 3x = 18, or x divided by 4 = 6, using positive numbers and fractions.
Students write simple inequalities like x > 5 to describe real situations where many answers work, such as "you need more than 5 dollars." Then they show all those answers as a shaded region on a number line.
Students plot positive and negative numbers as points on a grid, then use those points to draw shapes and measure their sides to solve real problems.
Students place fractions, decimals, and negative numbers on a number line, then plot pairs of those numbers as points on a grid with an x-axis and a y-axis.
Students plot points on a coordinate grid and explain what the positive or negative signs in each pair of coordinates reveal about which section of the grid the point lands in. They also compare two points that share the same numbers but have different signs.
Students plot points anywhere on a coordinate grid and use absolute value to measure the distance between two points that share the same row or column.
Students plot the corners of a shape on a grid using coordinate pairs, then measure the length of any side that runs straight up, down, or across by subtracting the two matching numbers.
| Standard | Definition | Code |
|---|---|---|
| Identify, write, evaluate | Students read and write expressions like 3x + 5, plug in numbers to find the value, and explain what the expression means in a real situation, such as the total cost of buying several items at a fixed price. | 6.PAR.6 |
| Write and evaluate numerical expressions involving rational bases and… | Exponents are a shorthand way to write repeated multiplication. Students learn to write and solve expressions like 2 to the 4th power or (1/2) squared, using whole-number exponents with positive, negative, and fractional bases. | 6.PAR.6.1 |
| Determine greatest common factors and least common multiples using a variety of… | Students find the largest number that divides evenly into two numbers and the smallest number both can divide into. These skills help solve real problems like splitting things into equal groups or finding when two events land on the same day. | 6.PAR.6.2 |
| Write and read expressions that represent operations with numbers and variables… | Students write and read math expressions like 3x + 5 to describe real situations, such as a starting amount plus equal groups added on. They translate between the written words and the symbolic shorthand. | 6.PAR.6.3 |
| Evaluate expressions when given values for the variables, including expressions… | Students substitute a number for each variable in an expression and calculate the result. For example, if a problem uses the expression 5x + 3, and x = 4, students find the answer by working through the arithmetic. | 6.PAR.6.4 |
| Apply the properties of operations to identify and generate equivalent… | Students use rules like the distributive property to rewrite math expressions in different forms that mean the same thing. Rearranging or regrouping numbers and variables helps confirm two expressions are equal. | 6.PAR.6.5 |
| Write and solve one-step equations and inequalities as mathematical models to… | Students write a simple equation or inequality to model a real situation, like figuring out how many items fit in a budget, then solve it. One operation is all it takes. | 6.PAR.7 |
| Solve one-step equations and inequalities involving variables when values for… | Students plug a number into a simple equation or inequality (like x + 4 = 10) to check whether it makes the statement true or false. They practice this with both equations and inequalities using values they are given. | 6.PAR.7.1 |
| Write one-step equations and inequalities to represent and solve problems | Students write a simple equation or inequality to solve a real problem, like figuring out how many items fit in a box given a limit. They also learn that a letter in math can stand for one missing number or a whole range of numbers. | 6.PAR.7.2 |
| Solve problems by writing and solving equations of the form x + p = q, px = q… | Students write simple equations to solve real problems, then find the missing number. This covers equations like x + 5 = 12, 3x = 18, or x divided by 4 = 6, using positive numbers and fractions. | 6.PAR.7.3 |
| Recognize and generate inequalities of the form x > c, x ≥ c, x ≤ c | Students write simple inequalities like x > 5 to describe real situations where many answers work, such as "you need more than 5 dollars." Then they show all those answers as a shaded region on a number line. | 6.PAR.7.4 |
| Graph rational numbers as points on the coordinate plane to represent and solve… | Students plot positive and negative numbers as points on a grid, then use those points to draw shapes and measure their sides to solve real problems. | 6.PAR.8 |
| Locate and position rational numbers on a horizontal or vertical number line | Students place fractions, decimals, and negative numbers on a number line, then plot pairs of those numbers as points on a grid with an x-axis and a y-axis. | 6.PAR.8.1 |
| Show and explain that signs of numbers in ordered pairs indicate locations in… | Students plot points on a coordinate grid and explain what the positive or negative signs in each pair of coordinates reveal about which section of the grid the point lands in. They also compare two points that share the same numbers but have different signs. | 6.PAR.8.2 |
| Solve problems by graphing points in all four quadrants of the coordinate plane | Students plot points anywhere on a coordinate grid and use absolute value to measure the distance between two points that share the same row or column. | 6.PAR.8.3 |
| Draw polygons in the coordinate plane given coordinates for the vertices | Students plot the corners of a shape on a grid using coordinate pairs, then measure the length of any side that runs straight up, down, or across by subtracting the two matching numbers. | 6.PAR.8.4 |
End-of-grade mathematics assessment for grades 3 through 8, aligned to Georgia's state-adopted math standards.
Students stretch beyond whole numbers into ratios, percents, and negative numbers. They divide fractions, work with decimals, solve simple equations, and start plotting points in all four quadrants of a graph. They also begin describing data using ideas like mean and median.
Cook together and ask how much is left when a recipe is doubled or halved. Round prices at the store and figure out the change. Five minutes of real-world fraction or decimal talk a few times a week builds more fluency than a worksheet.
A ratio compares two amounts, like 3 cups of flour for every 2 cups of sugar. A percent is just a ratio out of 100. Sixth grade is where students use these ideas to handle tips, sales, recipes, and speed problems on their own.
A common path is fraction and decimal operations first, then ratios and percents, then negative numbers and the coordinate plane, then expressions and one-step equations, and finally area, surface area, volume, and data. Ratios and negative numbers usually need the most time.
Dividing fractions, interpreting negative numbers on a number line, and writing equations from word problems are the usual sticking points. Building in spiral review of these three across the year prevents a painful spring scramble.
Have students read the problem out loud, then explain what is happening before touching any numbers. A quick sketch or a labeled bar often unlocks it. The goal is to slow down at the start, not to compute faster.
Collect real data from the class, such as minutes of sleep or steps walked, and build dot plots, histograms, and box plots from the same set. Students see how the shape of the data changes which measure of center actually tells the truth.
Students can divide fractions, work fluently with decimals and percents, solve one-step equations, plot points in all four quadrants, and find the area and volume of basic shapes. They can also read a graph and say something honest about what the data shows.