Working with expressions and exponents
Students start the year sharpening algebra skills. They rewrite expressions using exponent rules and add, subtract, and multiply polynomials so the symbols feel as natural as arithmetic.
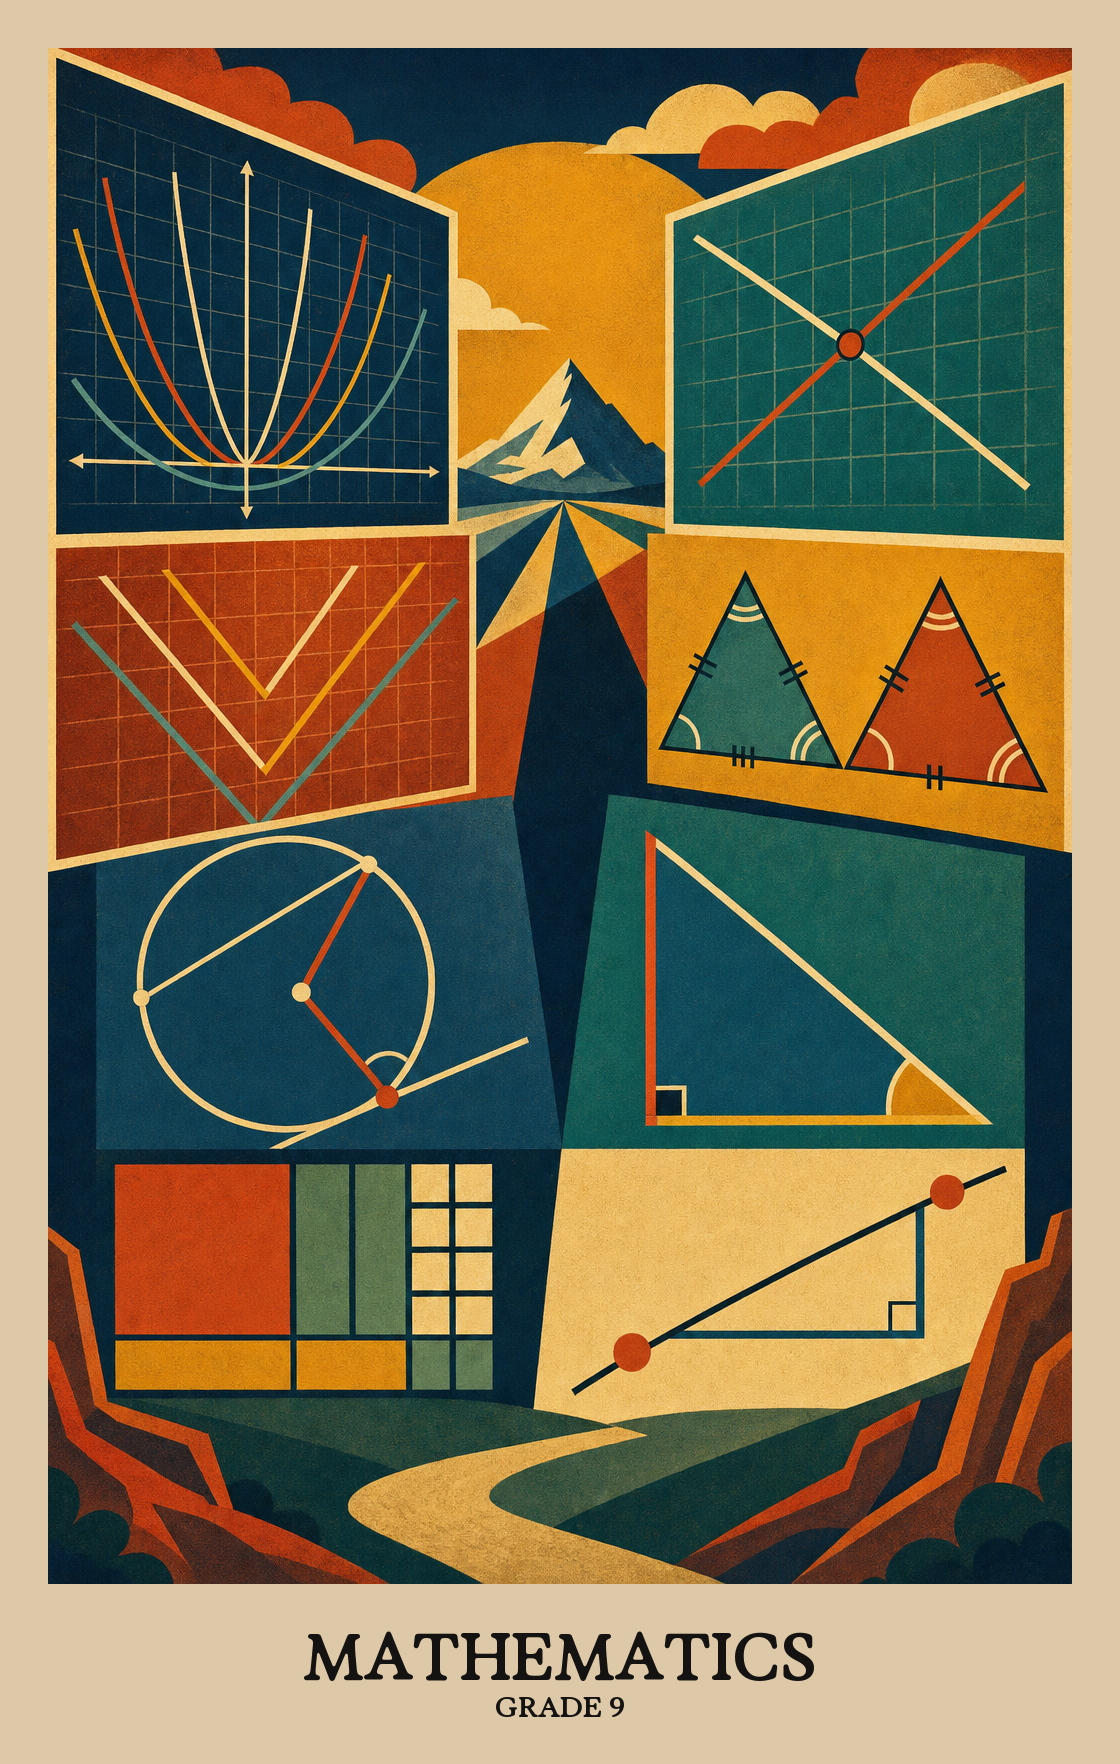
This is the year math shifts from solving for one answer to studying how whole families of equations and shapes behave. Students factor quadratics, solve systems of equations, and graph lines, parabolas, and absolute value functions. In geometry, they prove why triangles match up, work with circles, and use sine and cosine to find missing sides of right triangles. By spring, students can solve a quadratic equation, write the equation of a line through two points, and explain why two triangles are congruent.
Students start the year sharpening algebra skills. They rewrite expressions using exponent rules and add, subtract, and multiply polynomials so the symbols feel as natural as arithmetic.
Students move into solving. They factor and use the quadratic formula to find where a parabola crosses zero, solve pairs of linear equations, and shade the region that satisfies a system of inequalities.
Students graph lines, parabolas, and absolute value functions, reading off the high point, low point, and where the graph crosses each axis. They also combine simple functions to model situations like cost plus a fee.
Geometry begins with motion. Students slide, flip, rotate, and scale figures, then use those moves to argue that two triangles match in size or share the same shape. Compass and straightedge constructions show up here too.
Students prove facts about triangles, parallelograms, and circles, and use trigonometry to find missing sides and angles in right triangles. They also use coordinates, slope, and distance to check whether a shape is a rectangle or a parallel line.
The year ends with measurement and statistics. Students estimate volumes of real objects, compare data sets using center and spread, and fit a line to a scatter plot to describe how two things move together.
Students learn the rules for working with exponents, such as multiplying powers or raising a power to another power, then use those rules to rewrite numerical and algebraic expressions in equivalent forms.
| Standard | Definition | Code |
|---|---|---|
| Know and apply the properties of integer exponents to generate equivalent… | Students learn the rules for working with exponents, such as multiplying powers or raising a power to another power, then use those rules to rewrite numerical and algebraic expressions in equivalent forms. | N.RN.1 |
Factoring a quadratic expression means rewriting it as a product of simpler pieces to find where the function equals zero. Students use this to identify the x-values where a parabola crosses the horizontal axis.
Adding, subtracting, and multiplying expressions with variables and exponents, like combining (x² + 3x) and (2x + 5) into a single simplified expression. Students treat each term the way they would whole numbers, following the same rules they already know.
Solving a quadratic equation means finding the value of x that makes it true. Students choose the right method for the equation in front of them, whether that's taking a square root, factoring, or using the quadratic formula, and recognize when no real answer exists.
Students solve two equations at once to find the one pair of numbers that satisfies both. They use substitution or elimination to find where two lines cross on a graph.
Two straight lines drawn on a graph can cross at one point. That crossing point is the solution to both equations at once, because it is the only pair of numbers that makes both equations true.
Students solve two equations at once to find the one point where both are true. They use algebra to get an exact answer, or sketch the lines on a graph to estimate where they cross.
Two unknowns, two equations. Students set up and solve pairs of linear equations drawn from real situations, like finding two prices that add up correctly or two speeds that cover the right distance.
Students shade a region of the coordinate plane to show all the points that make an inequality true. When two inequalities apply at once, students find the overlapping region where both conditions are satisfied.
| Standard | Definition | Code |
|---|---|---|
| Factor a quadratic expression to reveal the zeros of the function it defines | Factoring a quadratic expression means rewriting it as a product of simpler pieces to find where the function equals zero. Students use this to identify the x-values where a parabola crosses the horizontal axis. | A.SS.3.a |
| Add, subtract, and multiply polynomials | Adding, subtracting, and multiplying expressions with variables and exponents, like combining (x² + 3x) and (2x + 5) into a single simplified expression. Students treat each term the way they would whole numbers, following the same rules they already know. | A.APR.1 |
| Solve quadratic equations by inspection | Solving a quadratic equation means finding the value of x that makes it true. Students choose the right method for the equation in front of them, whether that's taking a square root, factoring, or using the quadratic formula, and recognize when no real answer exists. | A.REI.5.a |
| Analyze and solve pairs of simultaneous linear equations | Students solve two equations at once to find the one pair of numbers that satisfies both. They use substitution or elimination to find where two lines cross on a graph. | A.REI.6 |
| Understand that solutions to a system of two linear equations in two variables… | Two straight lines drawn on a graph can cross at one point. That crossing point is the solution to both equations at once, because it is the only pair of numbers that makes both equations true. | A.REI.6.a |
| Solve systems of two linear equations in two variables algebraically | Students solve two equations at once to find the one point where both are true. They use algebra to get an exact answer, or sketch the lines on a graph to estimate where they cross. | A.REI.6.b |
| Solve real-world and mathematical problems leading to two linear equations in… | Two unknowns, two equations. Students set up and solve pairs of linear equations drawn from real situations, like finding two prices that add up correctly or two speeds that cover the right distance. | A.REI.6.c |
| Graph the solutions to a linear inequality in two variables as a half-plane | Students shade a region of the coordinate plane to show all the points that make an inequality true. When two inequalities apply at once, students find the overlapping region where both conditions are satisfied. | A.REI.10 |
Students graph lines, parabolas, and V-shaped absolute value curves, then label where each one crosses the axes, hits its highest or lowest point, and show what happens to the curve at its far ends.
Students rewrite the same line equation in different forms, like y = mx + b or ax + by = c, to read off the slope and where the line crosses an axis. Each form makes a different piece of information easier to spot.
Students practice combining two separate equations into one to model a real situation, like adding a flat fee to a per-mile rate to get a total cost.
| Standard | Definition | Code |
|---|---|---|
| Graph linear, quadratic and absolute value functions and show intercepts… | Students graph lines, parabolas, and V-shaped absolute value curves, then label where each one crosses the axes, hits its highest or lowest point, and show what happens to the curve at its far ends. | F.IF.7.a |
| Use different forms of linear functions, such as slope-intercept, standard | Students rewrite the same line equation in different forms, like y = mx + b or ax + by = c, to read off the slope and where the line crosses an axis. Each form makes a different piece of information easier to spot. | F.IF.8.a |
| Combine multiple functions to model complex relationships | Students practice combining two separate equations into one to model a real situation, like adding a flat fee to a per-mile rate to get a total cost. | F.BF.1.a |
Students test what happens to shapes when they slide, flip, or turn them. Using tracing paper or software, they check which properties (like size and angle) stay the same after each move.
Rigid motions like slides and flips move a line or segment to a new position without stretching it. The moved segment stays exactly the same length as the original.
When two shapes are congruent, their matching angles are equal in size. Students learn that moving or flipping a shape doesn't change its angles.
When two parallel lines (lines that never meet) are moved, rotated, or reflected, they stay parallel. Students learn that these rigid transformations preserve the relationship between lines.
Students look at a shape and decide whether it can be folded along a line to match itself, or spun around a center point and still look the same.
Transformations move, spin, or flip shapes on a coordinate grid. Students learn to describe exactly what happens to each point of a figure when it slides to a new position, rotates around a point, or reflects across a line.
Two shapes are congruent when one can be moved onto the other without stretching or distorting it. Students find the exact combination of slides, flips, and turns that lines one shape up perfectly with the other.
Students use slides, flips, and rotations to explain why two triangles match exactly. If every side and angle lines up perfectly after those moves, the triangles are congruent.
Students use angle and line rules to explain why shapes line up or measurements match. For example, they prove why crossing lines create equal angles, or why parallel lines cut by a third line produce matching angle pairs.
Students use triangle rules to build logical arguments: why the three inside angles always add to 180 degrees, why two sides being equal forces two angles to match, and why a line connecting two midpoints runs parallel to the base at exactly half its length.
Two triangles can be proven identical in size and shape without measuring every side and angle. Students use specific combinations of matching sides and angles, like two sides and the angle between them, to build a logical argument that the triangles are congruent.
Students use known rules about parallelograms to build logical arguments: opposite sides match, opposite angles match, and the two diagonals cut each other in half. They also explain why a rectangle qualifies as a parallelogram.
Students use a compass, straightedge, or folded paper to draw precise geometric figures: copying a segment or angle, splitting one in half, and drawing lines that are perfectly perpendicular or parallel.
Dilations shrink or stretch a shape by a set factor from a fixed center point. Students use geometric tools to confirm that the new shape stays proportional to the original and that lines through the center line up with the original figure.
Scaling a figure (dilation) shifts lines that don't pass through the center point to new positions, always keeping them parallel to where they started. Lines that run through the center stay exactly where they are.
When a line segment is stretched or shrunk by a scale factor, its new length equals the original length multiplied by that factor. A segment scaled by 3 is three times as long; scaled by one-half, it is half as long.
Dilations shrink or stretch a shape by a scale factor while keeping its angles and proportions the same. Students identify how each point moves and describe what changes about the figure's size.
Students look at two similar shapes and explain the exact steps (slides, flips, turns, or resizing) that would move one shape onto the other. The work happens both on a coordinate grid and without one.
Two shapes are similar when every pair of matching angles is equal and every pair of matching sides grows or shrinks by the same factor. Students use this to prove triangles are similar without measuring every part.
Right triangles with the same angles always have the same side ratios, no matter how big the triangle is. That consistency is what makes sine, cosine, and tangent work as reliable tools for finding unknown sides and angles.
Sine and cosine are linked for angles that add up to 90 degrees. Students learn that the sine of one angle equals the cosine of its partner, then use that shortcut to solve problems with right triangles.
Given a real-world situation with a right triangle, students use sine, cosine, tangent, and the Pythagorean Theorem to find missing side lengths and angles. Think ramps, shadows, and roof pitches.
Students explain why every circle is the same shape, just a different size. Any circle can be scaled up or down to match another, so all circles are similar figures.
Students study the hidden rules that govern angles and lines inside a circle. They learn why an angle drawn on a diameter always makes a right angle, and how the radius meets a tangent line at exactly 90 degrees.
Students prove why angles and side lengths behave the way they do when a polygon sits inside or around a circle. The reasoning depends on the relationships between the polygon's corners and the circle touching each side or vertex.
Students write the equation of a circle when given its center point and radius, then use that equation to draw the circle on a coordinate grid. It connects the geometry of a circle to its algebraic rule.
Students use x-y coordinates and formulas for slope, distance, and midpoint to prove geometric facts, like whether four plotted points actually form a rectangle.
Students use the slope of a line to prove why parallel lines always share the same slope and perpendicular lines have slopes that flip and negate each other. Then they apply those rules to write equations for new lines on a graph.
Students use coordinates on a graph to find the distance between points, then calculate the perimeter of a shape or the area of a triangle or rectangle. It's the same math used to measure a floor plan when you only have a grid.
Students explain why formulas like pi times radius squared actually work, using sketches and logical reasoning rather than just plugging in numbers. They break shapes apart or imagine shrinking pieces to show where each formula comes from.
Students explain why volume formulas work for shapes like cones and spheres by comparing cross-sections at equal heights. If two solids have the same cross-sectional area at every level, they have the same volume.
Students use familiar shapes like cylinders, rectangles, and spheres to model real objects. A tree trunk becomes a cylinder; a room becomes a rectangular box. The goal is using geometry to describe and measure things from the real world.
Students use area and volume to work out density problems, like how many people fit in a square mile or how much heat fills a room. The math connects a familiar measurement to a real-world quantity.
Students use shapes, measurements, and ratios to solve real design problems, like figuring out the best dimensions for a structure or layout that meets size limits or keeps costs down.
| Standard | Definition | Code |
|---|---|---|
| Verify experimentally | Students test what happens to shapes when they slide, flip, or turn them. Using tracing paper or software, they check which properties (like size and angle) stay the same after each move. | G.CO.1 |
| Lines are taken to lines | Rigid motions like slides and flips move a line or segment to a new position without stretching it. The moved segment stays exactly the same length as the original. | G.CO.1.a |
| Angles are taken to angles of the same measure | When two shapes are congruent, their matching angles are equal in size. Students learn that moving or flipping a shape doesn't change its angles. | G.CO.1.b |
| Parallel lines are taken to parallel lines | When two parallel lines (lines that never meet) are moved, rotated, or reflected, they stay parallel. Students learn that these rigid transformations preserve the relationship between lines. | G.CO.1.c |
| Identify any line and/or rotational symmetry within a figure | Students look at a shape and decide whether it can be folded along a line to match itself, or spun around a center point and still look the same. | G.CO.1.d |
| Recognize transformations as functions that take points in the plane as inputs… | Transformations move, spin, or flip shapes on a coordinate grid. Students learn to describe exactly what happens to each point of a figure when it slides to a new position, rotates around a point, or reflects across a line. | G.CO.2 |
| Given two congruent figures, describe a sequence of rigid motions that exhibits… | Two shapes are congruent when one can be moved onto the other without stretching or distorting it. Students find the exact combination of slides, flips, and turns that lines one shape up perfectly with the other. | G.CO.3 |
| Use the definition of congruence in terms of rigid motions to show that two… | Students use slides, flips, and rotations to explain why two triangles match exactly. If every side and angle lines up perfectly after those moves, the triangles are congruent. | G.CO.4 |
| Construct arguments about lines and angles using theorems | Students use angle and line rules to explain why shapes line up or measurements match. For example, they prove why crossing lines create equal angles, or why parallel lines cut by a third line produce matching angle pairs. | G.CO.7 |
| Construct arguments about the relationships within one triangle using theorems | Students use triangle rules to build logical arguments: why the three inside angles always add to 180 degrees, why two sides being equal forces two angles to match, and why a line connecting two midpoints runs parallel to the base at exactly half its length. | G.CO.8 |
| Construct arguments about the relationships between two triangles using theorems | Two triangles can be proven identical in size and shape without measuring every side and angle. Students use specific combinations of matching sides and angles, like two sides and the angle between them, to build a logical argument that the triangles are congruent. | G.CO.9 |
| Construct arguments about parallelograms using theorems | Students use known rules about parallelograms to build logical arguments: opposite sides match, opposite angles match, and the two diagonals cut each other in half. They also explain why a rectangle qualifies as a parallelogram. | G.CO.10 |
| Make formal geometric constructions with a variety of tools and methods | Students use a compass, straightedge, or folded paper to draw precise geometric figures: copying a segment or angle, splitting one in half, and drawing lines that are perfectly perpendicular or parallel. | G.CO.11 |
| Use geometric constructions to verify the properties of dilations given by a… | Dilations shrink or stretch a shape by a set factor from a fixed center point. Students use geometric tools to confirm that the new shape stays proportional to the original and that lines through the center line up with the original figure. | G.SRT.1 |
| A dilation takes a line not passing through the center of the dilation to a… | Scaling a figure (dilation) shifts lines that don't pass through the center point to new positions, always keeping them parallel to where they started. Lines that run through the center stay exactly where they are. | G.SRT.1.a |
| The dilation of a line segment is longer or shorter in the ratio given by the… | When a line segment is stretched or shrunk by a scale factor, its new length equals the original length multiplied by that factor. A segment scaled by 3 is three times as long; scaled by one-half, it is half as long. | G.SRT.1.b |
| Recognize transformations as functions that take points in the plane as inputs… | Dilations shrink or stretch a shape by a scale factor while keeping its angles and proportions the same. Students identify how each point moves and describe what changes about the figure's size. | G.SRT.2 |
| Given two similar figures, describe a sequence of transformations that exhibits… | Students look at two similar shapes and explain the exact steps (slides, flips, turns, or resizing) that would move one shape onto the other. The work happens both on a coordinate grid and without one. | G.SRT.3 |
| Understand the meaning of similarity for two-dimensional figures as the… | Two shapes are similar when every pair of matching angles is equal and every pair of matching sides grows or shrinks by the same factor. Students use this to prove triangles are similar without measuring every part. | G.SRT.4 |
| Show that by similarity, side ratios in right triangles are properties of the… | Right triangles with the same angles always have the same side ratios, no matter how big the triangle is. That consistency is what makes sine, cosine, and tangent work as reliable tools for finding unknown sides and angles. | G.SRT.7 |
| Explain and use the relationship between the sine and cosine of complementary… | Sine and cosine are linked for angles that add up to 90 degrees. Students learn that the sine of one angle equals the cosine of its partner, then use that shortcut to solve problems with right triangles. | G.SRT.8 |
| Use trigonometric ratios and the Pythagorean Theorem to solve right triangles… | Given a real-world situation with a right triangle, students use sine, cosine, tangent, and the Pythagorean Theorem to find missing side lengths and angles. Think ramps, shadows, and roof pitches. | G.SRT.9 |
| Construct arguments that all circles are similar | Students explain why every circle is the same shape, just a different size. Any circle can be scaled up or down to match another, so all circles are similar figures. | G.C.1 |
| Identify and describe relationships among inscribed angles, radii | Students study the hidden rules that govern angles and lines inside a circle. They learn why an angle drawn on a diameter always makes a right angle, and how the radius meets a tangent line at exactly 90 degrees. | G.C.2 |
| Construct arguments using properties of polygons inscribed and circumscribed… | Students prove why angles and side lengths behave the way they do when a polygon sits inside or around a circle. The reasoning depends on the relationships between the polygon's corners and the circle touching each side or vertex. | G.C.3 |
| Write the equation of a circle given the center and radius or a graph of the… | Students write the equation of a circle when given its center point and radius, then use that equation to draw the circle on a coordinate grid. It connects the geometry of a circle to its algebraic rule. | G.GPE.1 |
| Use coordinates to prove simple geometric theorems algebraically, including the… | Students use x-y coordinates and formulas for slope, distance, and midpoint to prove geometric facts, like whether four plotted points actually form a rectangle. | G.GPE.6 |
| Prove the slope criteria for parallel and perpendicular lines and use them to… | Students use the slope of a line to prove why parallel lines always share the same slope and perpendicular lines have slopes that flip and negate each other. Then they apply those rules to write equations for new lines on a graph. | G.GPE.7 |
| Use coordinates to compute perimeters of polygons and areas of triangles and… | Students use coordinates on a graph to find the distance between points, then calculate the perimeter of a shape or the area of a triangle or rectangle. It's the same math used to measure a floor plan when you only have a grid. | G.GPE.8 |
| Give an informal argument for the formulas for the circumference of a circle… | Students explain why formulas like pi times radius squared actually work, using sketches and logical reasoning rather than just plugging in numbers. They break shapes apart or imagine shrinking pieces to show where each formula comes from. | G.GMD.1 |
| Give an informal argument using Cavalieri's principle for the formulas for the… | Students explain why volume formulas work for shapes like cones and spheres by comparing cross-sections at equal heights. If two solids have the same cross-sectional area at every level, they have the same volume. | G.GMD.2 |
| Use geometric shapes, their measures | Students use familiar shapes like cylinders, rectangles, and spheres to model real objects. A tree trunk becomes a cylinder; a room becomes a rectangular box. The goal is using geometry to describe and measure things from the real world. | G.MG.1 |
| Apply concepts of density and displacement based on area and volume in modeling… | Students use area and volume to work out density problems, like how many people fit in a square mile or how much heat fills a room. The math connects a familiar measurement to a real-world quantity. | G.MG.2 |
| Apply geometric methods to solve design problems | Students use shapes, measurements, and ratios to solve real design problems, like figuring out the best dimensions for a structure or layout that meets size limits or keeps costs down. | G.MG.3 |
Given two sets of real data, students pick the right summary numbers to describe and compare them. That means finding the middle value or average, then measuring how spread out the numbers are, using tools like the interquartile range or standard deviation.
Reading a dot plot, histogram, or box plot, students describe what the shape, middle, and spread of the data actually mean, and explain how one unusually high or low value can skew the whole picture.
Students read a table that cross-references two categories, like grade level and favorite subject, and calculate the share of the total each cell represents. From those percentages, students spot patterns and draw conclusions about how the two categories relate.
Students plot two sets of numbers on a graph to see if a pattern shows up between them. For example, they might check whether more study hours tend to go with higher test scores.
Students use a line of best fit to answer real questions about data. For example, they might use the line to predict a value or describe how one quantity changes as another increases.
Students draw a straight line that best fits a scatter plot, then use that line to make predictions. For example, they might estimate a test score based on hours studied.
Students read a trend line on a scatter plot and explain what the slope and starting point actually mean for that data. For example, they might say that each extra hour of studying predicts two more points on a test score.
| Standard | Definition | Code |
|---|---|---|
| Use statistics appropriate to the shape of the data distribution to compare… | Given two sets of real data, students pick the right summary numbers to describe and compare them. That means finding the middle value or average, then measuring how spread out the numbers are, using tools like the interquartile range or standard deviation. | S.ID.1 |
| Interpret differences in shape, center | Reading a dot plot, histogram, or box plot, students describe what the shape, middle, and spread of the data actually mean, and explain how one unusually high or low value can skew the whole picture. | S.ID.2 |
| Summarize categorical data for two categories in two-way frequency tables | Students read a table that cross-references two categories, like grade level and favorite subject, and calculate the share of the total each cell represents. From those percentages, students spot patterns and draw conclusions about how the two categories relate. | S.ID.4 |
| Represent data on two quantitative variables on a scatter plot | Students plot two sets of numbers on a graph to see if a pattern shows up between them. For example, they might check whether more study hours tend to go with higher test scores. | S.ID.5 |
| Use a given linear function to solve problems in the context of data | Students use a line of best fit to answer real questions about data. For example, they might use the line to predict a value or describe how one quantity changes as another increases. | S.ID.5.a |
| Fit a linear function to data and use it to solve problems in the context of… | Students draw a straight line that best fits a scatter plot, then use that line to make predictions. For example, they might estimate a test score based on hours studied. | S.ID.5.b |
| Interpret the slope | Students read a trend line on a scatter plot and explain what the slope and starting point actually mean for that data. For example, they might say that each extra hour of studying predicts two more points on a test score. | S.ID.6 |
KAP mathematics assessment for grades 3 through 8 and grade 10, aligned to the Kansas Mathematics Standards.
Students spend most of the year on algebra and geometry. They factor and solve quadratic equations, solve systems of two equations, and graph lines and parabolas. In geometry, they prove things about triangles, circles, and parallelograms, and start using sine and cosine to solve right triangles.
Ask students to explain one problem out loud before checking the answer. Talking through the steps catches small mistakes and shows where the thinking broke down. If students are stuck, have them sketch the problem or write what they already know on the side of the page.
By June, students should solve a quadratic equation by factoring, square roots, or the formula, and pick the method that fits. They should solve a system of two equations without a calculator, write the equation of a line through two points, and use sine, cosine, and tangent to find a missing side or angle in a right triangle.
Most teachers open with exponents and polynomial operations, move into linear equations and systems, then spend a long stretch on quadratics. Geometry usually starts after winter break with transformations and congruence, then similarity and right-triangle trigonometry, and closes with circles, coordinate proofs, and a short statistics unit.
Practicing integer operations, fractions, and solving simple equations for 10 minutes a few nights a week makes a real difference. Free sites like Khan Academy have short refreshers on these topics. Strong middle-school skills make factoring and systems much less painful later.
Factoring trinomials, the difference between solving and simplifying, and reading word problems into a system of equations are the three big ones. In geometry, students often confuse congruence with similarity and forget which side is opposite or adjacent when setting up a trig ratio.
A calculator is useful for messy arithmetic and graphing, but students need to factor, solve, and simplify by hand to understand what the calculator is doing. A good rule at home is to try the problem on paper first and use the calculator only to check.
Students move from spotting patterns to writing short arguments with reasons. They use theorems about triangles, parallel lines, and circles to explain why something must be true, and they use coordinates with slope and distance to prove that a figure is a rectangle or that two lines are parallel.
Students are ready when they can move between the graph, the equation, and a word problem for both lines and parabolas without restarting from scratch. They should also be comfortable setting up a right-triangle problem with trigonometry and writing a short proof using a theorem from class.