Place value and decimals
Students extend place value into the thousandths. They compare decimals, find a number that is 0.01 more or less, and connect fractions to their decimal forms using visual models.
This is the year math moves from working with whole numbers to working confidently with fractions and decimals. Students multiply larger numbers, divide by two-digit numbers, and add and subtract fractions with unlike denominators. They also start finding the volume of boxes by counting unit cubes or multiplying length by width by height. By spring, students can add fractions like 1/2 and 1/3, compare decimals to the thousandths place, and plot points on a coordinate grid.
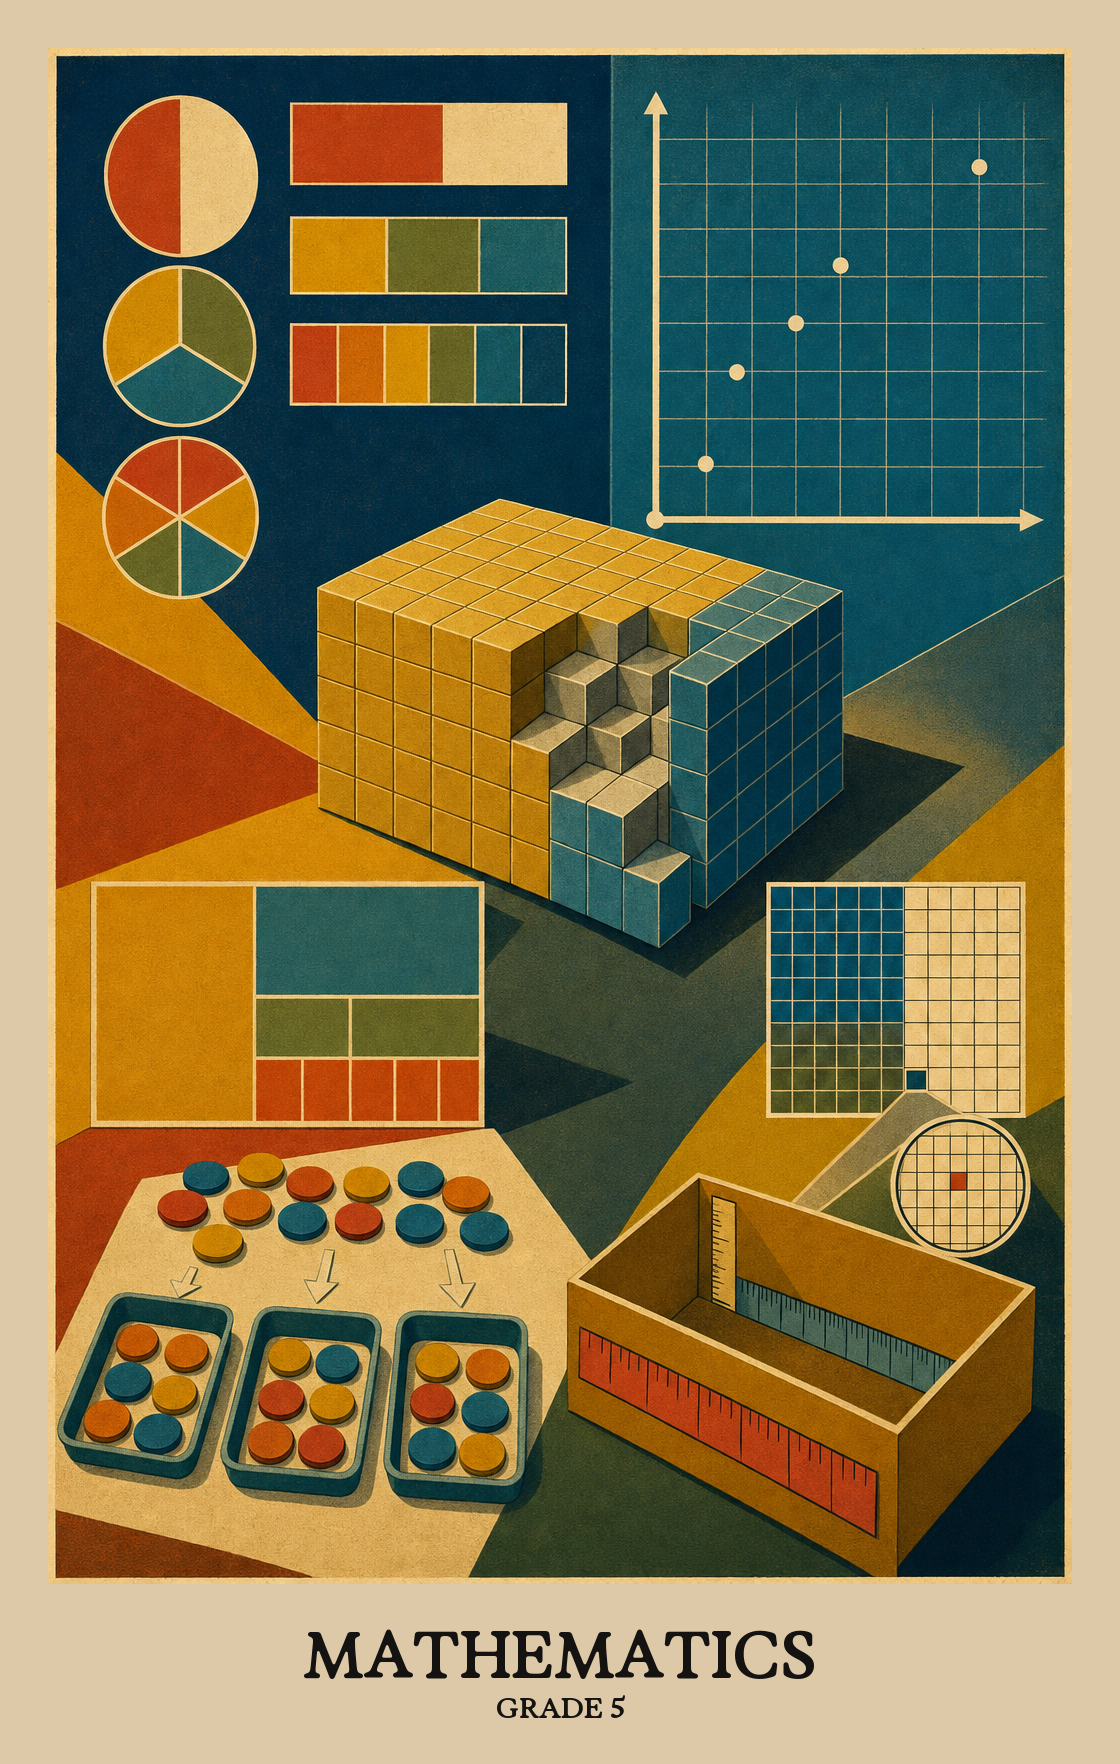
Students extend place value into the thousandths. They compare decimals, find a number that is 0.01 more or less, and connect fractions to their decimal forms using visual models.
Students multiply larger numbers using area models and place value, and divide by one- and two-digit numbers. They decide whether a remainder should be written as a leftover, a fraction, or a decimal.
Students add and subtract fractions and mixed numbers with unlike denominators. They estimate to the nearest half, find equivalent fractions, and solve word problems with both fractions and decimals.
Students use pictures and number lines to take a fraction of a group or split an amount into fractional shares. They start to see multiplication as scaling and use ratio tables to solve real situations.
Students find the area of triangles and parallelograms, then move to volume by packing rectangular boxes with unit cubes. They sort prisms and pyramids by faces, edges, and vertices, and draw nets.
Students plot points in the first quadrant, build rules from tables, and read double-bar and line graphs. They find mean, median, and range, and use a frequency table to predict how likely something is.
Students look at a set of numbers or a chart, spot patterns, and come up with a question that data could actually answer. The focus is on noticing what the numbers show and asking something worth investigating.
Qualitative data describes categories, like favorite colors or types of pets. Quantitative data uses numbers, like heights or test scores. Students learn to tell the difference and explain why it matters for a given question.
Students gather real data to answer a question they came up with, then find the middle value and the average of that data to see what's typical. They also look at how spread out the numbers are and display the results in a chart or graph.
Students look at charts and graphs, find the middle value or the spread of the data, and use what they see to back up a claim or solve a problem.
Students look at the same set of data shown in two different charts or graphs and explain how the choice of display changes what you notice first and what conclusions you can draw.
Students run a simple experiment, like flipping a coin or rolling a number cube, then record how many times each result comes up in a frequency table.
Students run an experiment, record how often each result happens in a frequency table, and use those counts to predict how likely it is to happen again. Those predictions get plotted on a number line between 0 (impossible) and 1 (certain).
| Standard | Definition | Code |
|---|---|---|
| Notice and describe patterns in data-rich situations or given related data sets… | Students look at a set of numbers or a chart, spot patterns, and come up with a question that data could actually answer. The focus is on noticing what the numbers show and asking something worth investigating. | 5.1.1.1 |
| Compare and contrast between qualitative and quantitative data | Qualitative data describes categories, like favorite colors or types of pets. Quantitative data uses numbers, like heights or test scores. Students learn to tell the difference and explain why it matters for a given question. | 5.1.1.2 |
| Collect and organize data to answer statistical questions and analyze measures… | Students gather real data to answer a question they came up with, then find the middle value and the average of that data to see what's typical. They also look at how spread out the numbers are and display the results in a chart or graph. | 5.1.1.3 |
| Critically analyze data visualizations using measures of center and… | Students look at charts and graphs, find the middle value or the spread of the data, and use what they see to back up a claim or solve a problem. | 5.1.1.4 |
| Compare and contrast different data displays to determine how the… | Students look at the same set of data shown in two different charts or graphs and explain how the choice of display changes what you notice first and what conclusions you can draw. | 5.1.1.5 |
| List outcomes from a probability experiment in a frequency table | Students run a simple experiment, like flipping a coin or rolling a number cube, then record how many times each result comes up in a frequency table. | 5.1.2.1 |
| Use a frequency table to record results from an experiment to make predictions | Students run an experiment, record how often each result happens in a frequency table, and use those counts to predict how likely it is to happen again. Those predictions get plotted on a number line between 0 (impossible) and 1 (certain). | 5.1.2.2 |
Students figure out the area of shapes like parallelograms and triangles using formulas they can explain. They also find the area of more complex shapes by breaking them into smaller, familiar pieces.
Students estimate how much surface a shape covers by counting squares on grid paper, even when the shape has curved or irregular edges.
Students pack small cubes into a box or shape and count them to find the total volume. Each cube represents one cubic unit, so the number of cubes tells you how much space the shape holds inside.
Students figure out how much space a 3D shape takes up and how much surface it has by counting and arranging small unit cubes. They use more than one method and check that their answers make sense.
Students pack a box shape with unit cubes to find its volume, then confirm the same answer by multiplying length times width times height. Both methods should match.
Students sort 3-D shapes like boxes and tents by counting their flat faces, sharp corners, and straight edges. A prism has two matching bases; a pyramid narrows to a point.
Students unfold 3-D shapes like boxes and cones in their minds, then draw the flat pattern of faces that would fold back up into that shape.
| Standard | Definition | Code |
|---|---|---|
| Develop, justify and use formulas to determine the area of parallelograms and… | Students figure out the area of shapes like parallelograms and triangles using formulas they can explain. They also find the area of more complex shapes by breaking them into smaller, familiar pieces. | 5.2.3.1 |
| Estimate the area of two-dimensional shapes, both polygons and non-polygons… | Students estimate how much surface a shape covers by counting squares on grid paper, even when the shape has curved or irregular edges. | 5.2.3.2 |
| Use unit cubes to measure volume | Students pack small cubes into a box or shape and count them to find the total volume. Each cube represents one cubic unit, so the number of cubes tells you how much space the shape holds inside. | 5.2.3.3 |
| Use various strategies to measure the volume and surface area of… | Students figure out how much space a 3D shape takes up and how much surface it has by counting and arranging small unit cubes. They use more than one method and check that their answers make sense. | 5.2.3.4 |
| Find the volume of a right rectangular prism with whole-number side lengths by… | Students pack a box shape with unit cubes to find its volume, then confirm the same answer by multiplying length times width times height. Both methods should match. | 5.2.3.5 |
| Classify and describe prisms and pyramids by their defining attributes and the… | Students sort 3-D shapes like boxes and tents by counting their flat faces, sharp corners, and straight edges. A prism has two matching bases; a pyramid narrows to a point. | 5.2.4.1 |
| Recognize, draw and compare different nets for prisms, pyramids, cylinders and… | Students unfold 3-D shapes like boxes and cones in their minds, then draw the flat pattern of faces that would fold back up into that shape. | 5.2.4.2 |
Multiply two large numbers together, such as 47 times 83, using a strategy that makes sense and then explain why it works. Students break numbers apart by place value or use an area model to keep track of the math.
Students divide large numbers by a one- or two-digit number and make sense of the answer, whether it comes out even, leaves a remainder, or becomes a fraction or decimal.
When dividing, students decide whether a leftover amount should be kept as a fraction, rounded up, or dropped entirely, based on what the problem is actually asking.
Students solve word problems that mix addition, subtraction, multiplication, and division across several steps. They check whether their answer makes sense by working backward, using a calculator, or asking if the result fits the situation.
Students find fractions equal in value by multiplying or dividing the top and bottom numbers by the same amount. They use pictures or diagrams to show why the two fractions are the same.
Students practice adding or subtracting small decimal amounts in their head, such as finding a cent more or less than a price. They explain their thinking using a number line or place-value chart.
Each digit in a number is worth 10 times more than the same digit one spot to its right. Students use that pattern to understand why the 4 in 400 is worth ten times the 4 in 40.
Students match fractions and decimals that name the same amount, going as far as three places past the decimal point. They show why the two forms are equal using grids, number lines, or place value reasoning.
Students line up decimal numbers in order from smallest to largest, reading out to the thousandths place. They explain their thinking using place value and a number line or grid.
Students estimate whether a fraction answer lands closer to 0, 1/2, or 1 before doing the full calculation. They explain why their estimate makes sense using those reference points.
Add and subtract fractions with different bottom numbers, including mixed numbers like 2 1/2. Students show their work using equivalent fractions or a number line to prove the answer makes sense.
Students practice rounding decimal numbers to get a ballpark answer before adding or subtracting them. The goal is a close-enough answer, fast, so students can check whether a precise calculation looks right.
Students add and subtract fractions and decimals to solve real-world problems, like splitting a recipe or calculating change. They use drawings, number lines, or equations to find the answer and check that it makes sense.
Students multiply a whole number by a fraction by drawing it on a number line or other picture, then explain what the image shows. For example, 3 x 3/4 means three groups of three-fourths.
Students find a fraction of a whole number, such as 3/4 of 20, by drawing a number line or other picture and explaining what the picture shows.
Students divide a whole number by a fraction to find how many groups fit inside a total. They draw a picture to show their thinking and explain what the picture means.
Students solve word problems that mix adding and subtracting fractions and decimals across several steps. They check whether their answers make sense by working backward or thinking about what the numbers mean in the real situation.
Students compare paying with cash, a check, a credit card, and a debit card. They add, subtract, multiply, and divide to see how each method works, then weigh the pros and cons of each.
Students build a simple budget by adding, subtracting, multiplying, and dividing real costs. They practice separating wants from needs and look at what happens when spending more than you earn adds up over time.
Students figure out the missing number in an equation like 2.5 + ___ = 4.1 or 1/2 + ___ = 3/4. Then they explain whether the equation is true or false and show their reasoning.
Students make predictions about how an equation will behave when it uses parentheses or the four operations, then explain why two different-looking number sentences are actually equal.
Students use a rule or table to create ordered pairs of positive whole numbers, then plot those pairs as points on a coordinate grid.
Students look at two patterns side by side, then explain how one changes as the other changes. They record the relationship in a table or plot it as points on a grid.
Students plot whole and half numbers as points on a grid, then explain what those points mean in a real situation, like tracking how far a bike travels over time.
Students use ratio tables to compare quantities by adding or multiplying, then explain what it means to scale a number up or down by multiplying. For example, doubling a recipe or finding equivalent speeds.
Students look at a repeating visual pattern, write a rule that connects the figure number to how many pieces it contains, then use that rule to predict any figure in the sequence.
| Standard | Definition | Code |
|---|---|---|
| Multiply two multi-digit numbers using an efficient strategy | Multiply two large numbers together, such as 47 times 83, using a strategy that makes sense and then explain why it works. Students break numbers apart by place value or use an area model to keep track of the math. | 5.3.5.1 |
| Divide multi-digit numbers by a one-digit or two-digit divisor using efficient… | Students divide large numbers by a one- or two-digit number and make sense of the answer, whether it comes out even, leaves a remainder, or becomes a fraction or decimal. | 5.3.5.2 |
| Consider the context of a problem involving division to select the most useful… | When dividing, students decide whether a leftover amount should be kept as a fraction, rounded up, or dropped entirely, based on what the problem is actually asking. | 5.3.5.3 |
| Solve multi-step contextual situations requiring addition, subtraction… | Students solve word problems that mix addition, subtraction, multiplication, and division across several steps. They check whether their answer makes sense by working backward, using a calculator, or asking if the result fits the situation. | 5.3.5.4 |
| Generate equivalent fractions of the forms = 𝑏𝑏 𝑛𝑛 𝑥𝑥 𝑏𝑏 𝑎𝑎 𝑎𝑎 ÷… | Students find fractions equal in value by multiplying or dividing the top and bottom numbers by the same amount. They use pictures or diagrams to show why the two fractions are the same. | 5.3.5.5 |
| Given a value, mentally find 0.1 more or 0.1 less, 0.01 more or 0.01 less and… | Students practice adding or subtracting small decimal amounts in their head, such as finding a cent more or less than a price. They explain their thinking using a number line or place-value chart. | 5.3.5.6 |
| Recognize that in a multi-digit number, a digit in one place represents 10… | Each digit in a number is worth 10 times more than the same digit one spot to its right. Students use that pattern to understand why the 4 in 400 is worth ten times the 4 in 40. | 5.3.5.7 |
| Recognize and flexibly generate equivalences between fractions and decimals to… | Students match fractions and decimals that name the same amount, going as far as three places past the decimal point. They show why the two forms are equal using grids, number lines, or place value reasoning. | 5.3.5.8 |
| Compare and order decimal values to the thousandths | Students line up decimal numbers in order from smallest to largest, reading out to the thousandths place. They explain their thinking using place value and a number line or grid. | 5.3.5.9 |
| Estimate sums and differences of fractions and mixed numbers to the nearest half | Students estimate whether a fraction answer lands closer to 0, 1/2, or 1 before doing the full calculation. They explain why their estimate makes sense using those reference points. | 5.3.5.10 |
| Fluently add and subtract fractions with unlike denominators | Add and subtract fractions with different bottom numbers, including mixed numbers like 2 1/2. Students show their work using equivalent fractions or a number line to prove the answer makes sense. | 5.3.5.11 |
| Estimate sums and differences of decimals | Students practice rounding decimal numbers to get a ballpark answer before adding or subtracting them. The goal is a close-enough answer, fast, so students can check whether a precise calculation looks right. | 5.3.5.12 |
| Solve contextual situations using addition and subtraction of positive rational… | Students add and subtract fractions and decimals to solve real-world problems, like splitting a recipe or calculating change. They use drawings, number lines, or equations to find the answer and check that it makes sense. | 5.3.5.13 |
| Represent multiplication of a whole number of 𝑎𝑎 fractional groups, 𝑛𝑛 x… | Students multiply a whole number by a fraction by drawing it on a number line or other picture, then explain what the image shows. For example, 3 x 3/4 means three groups of three-fourths. | 5.3.5.14 |
| Represent contextual multiplication situations of a 𝑎𝑎 fractional amount of… | Students find a fraction of a whole number, such as 3/4 of 20, by drawing a number line or other picture and explaining what the picture shows. | 5.3.5.15 |
| Represent contextual measurement situations using 𝑎𝑎 division of the form… | Students divide a whole number by a fraction to find how many groups fit inside a total. They draw a picture to show their thinking and explain what the picture means. | 5.3.5.16 |
| Solve multi-step contextual situations using addition and subtraction of… | Students solve word problems that mix adding and subtracting fractions and decimals across several steps. They check whether their answers make sense by working backward or thinking about what the numbers mean in the real situation. | 5.3.5.17 |
| Use the four operations to compare and contrast different ways of paying and… | Students compare paying with cash, a check, a credit card, and a debit card. They add, subtract, multiply, and divide to see how each method works, then weigh the pros and cons of each. | 5.3.5.18 |
| Use the four operations to create an individual or group budget based on wants… | Students build a simple budget by adding, subtracting, multiplying, and dividing real costs. They practice separating wants from needs and look at what happens when spending more than you earn adds up over time. | 5.3.5.19 |
| Use relational thinking to find a missing value in an open number sentence with… | Students figure out the missing number in an equation like 2.5 + ___ = 4.1 or 1/2 + ___ = 3/4. Then they explain whether the equation is true or false and show their reasoning. | 5.3.6.1 |
| Make conjectures and justifications about numerical expressions involving… | Students make predictions about how an equation will behave when it uses parentheses or the four operations, then explain why two different-looking number sentences are actually equal. | 5.3.6.2 |
| Use a rule or table to represent ordered pairs of positive integers and graph… | Students use a rule or table to create ordered pairs of positive whole numbers, then plot those pairs as points on a coordinate grid. | 5.3.7.1 |
| Identify and explain apparent relationships between two patterns from given… | Students look at two patterns side by side, then explain how one changes as the other changes. They record the relationship in a table or plot it as points on a grid. | 5.3.7.2 |
| Represent contextual situations by graphing whole and half number points in the… | Students plot whole and half numbers as points on a grid, then explain what those points mean in a real situation, like tracking how far a bike travels over time. | 5.3.7.3 |
| Use ratio tables with whole numbers to solve situations with additive and… | Students use ratio tables to compare quantities by adding or multiplying, then explain what it means to scale a number up or down by multiplying. For example, doubling a recipe or finding equivalent speeds. | 5.3.7.4 |
| Develop an explicit rule that generalizes a visual pattern relating the figure… | Students look at a repeating visual pattern, write a rule that connects the figure number to how many pieces it contains, then use that rule to predict any figure in the sequence. | 5.3.7.5 |
Standards-based mathematics assessment for grades 3 through 8 and grade 11, aligned to Minnesota Academic Standards.
Alternate standards-based assessment for eligible students with the most significant cognitive disabilities, administered in the same subjects and grades as the MCA program.
Students should multiply and divide larger numbers fluently, add and subtract fractions with different bottom numbers, and work confidently with decimals to the thousandths place. They should also find the area of triangles and the volume of boxes built from unit cubes.
Cook together. Doubling a recipe that calls for 3/4 cup or splitting 2 1/2 cups between three bowls gives real practice with adding, subtracting, and comparing fractions. Ask students to show the math on paper after they pour.
Spend five minutes a few nights a week on multiplication facts up to 12. Strong recall of basic facts is what makes multi-digit multiplication and long division feel possible. Flashcards, dice games, or a quick app session all work.
Build place value to the thousandths first, then move into fraction and decimal equivalence so students can see 0.75 and 3/4 as the same amount. Save fraction addition with unlike denominators until equivalence is solid, or the procedures feel like tricks.
Long division with two-digit divisors, adding fractions with unlike denominators, and interpreting remainders in word problems. Plan extra time for each, and expect to come back to them after the first pass.
Have students read the problem out loud, then say what the question is asking before picking an operation. Drawing a quick picture or bar model often unsticks problems with fractions, money, or measurement.
Students find the area of triangles and shapes built from rectangles and triangles, and they measure the volume of boxes by counting unit cubes or multiplying length, width, and height. A cereal box and a ruler at home cover most of it.
Look for fluent multi-digit multiplication and division, confident work with fractions and decimals in real situations, and the ability to plot points on a coordinate grid. Students should also explain their reasoning, not just get an answer.
Yes. Plotting points in the first quadrant and reading patterns from a table sets up ratios, proportions, and early algebra next year. A few rounds of battleship or graphing a daily temperature at home builds the habit.