Skip to content

What does a student learn in ?

This is the year students start working with negative numbers like real tools, not just symbols on a number line. They add, subtract, multiply, and divide positive and negative fractions and decimals, and they use those skills to set up budgets, calculate tips, taxes, and discounts. Proportions become the backbone of the year, showing up in scale drawings, unit rates, and the link between a circle's diameter and its distance around. By spring, students can solve a two-step equation with negatives and figure out the sale price of an item after a percent off.

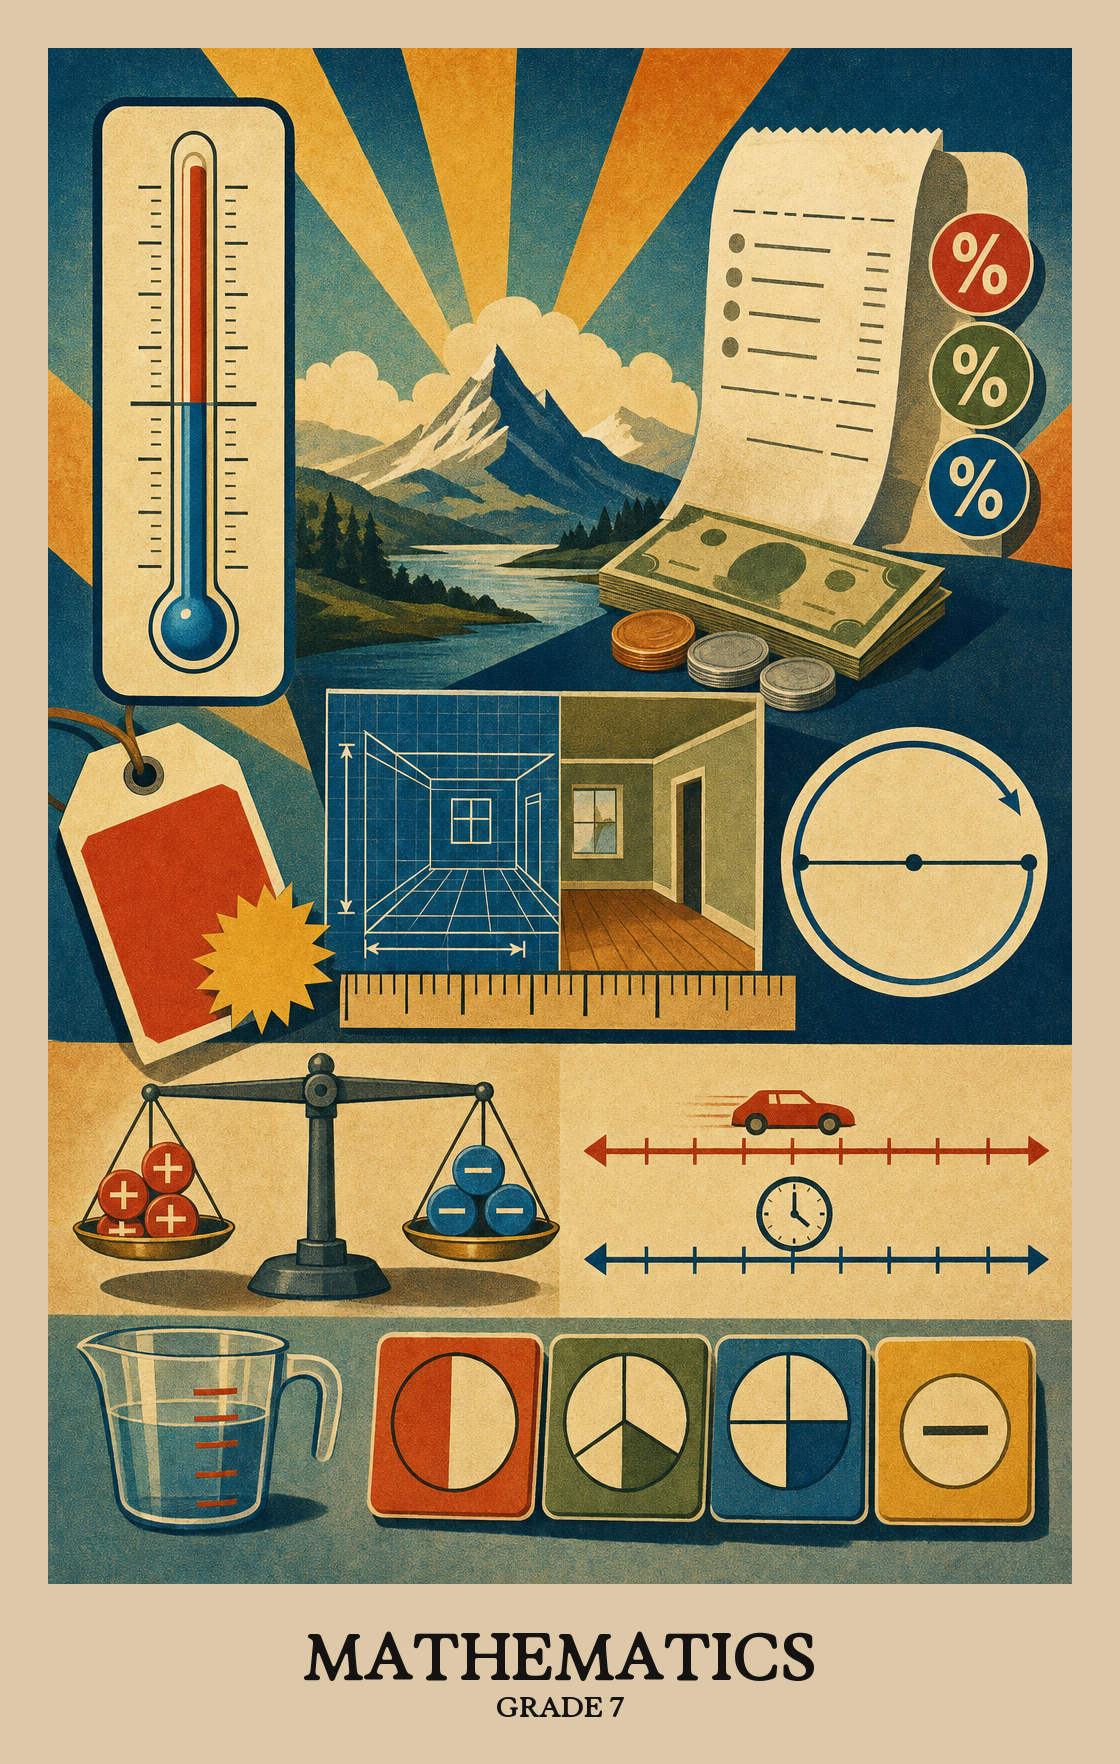
Illustration of what students learn in Grade 7 Mathematics
  • Negative numbers
  • Proportions
  • Percent and money
  • Circles
  • Two-step equations
  • Probability
  • Scale drawings
Source: Minnesota Minnesota Academic Standards
Year at a glance
How the year usually goes. Every school and district set their own curriculum, so treat this as a guide, not official pacing.
  1. 1

    Rational numbers and the number line

    Students work with positive and negative numbers, including fractions and decimals. They add, subtract, multiply, and divide signed numbers, and use the number line to compare values and measure distance between them.

  2. 2

    Ratios, rates, and proportions

    Students decide when two quantities grow together at a steady rate. They move between tables, graphs, and equations to find the unit rate and solve problems like recipes, maps, and speed.

  3. 3

    Percents and money math

    Students use percents for real money situations: sales tax, tips, discounts, simple interest, and percent change. They also build a budget and figure out what share of the total each category takes.

  4. 4

    Expressions, equations, and inequalities

    Students write and solve two-step equations and inequalities that come from word problems. They rewrite expressions using the distributive property and graph the solutions to inequalities on a number line.

  5. 5

    Circles, scale, and 3D shapes

    Students find the circumference and area of circles using pi, and the surface area and volume of cylinders. They also work with scale drawings and figure out how side lengths and areas change when a shape is resized.

  6. 6

    Samples, data, and probability

    Students collect data from samples to make claims about a larger group, and they display results in tables, circle graphs, and histograms. They find the probability of events like coin flips or spinners using lists, tables, and tree diagrams.

Mastery Learning Standards
The required skills a student should display by the end of Grade 7.
Data Analysis
  • Formulate statistical investigative questions with data collection, keeping…

    7.1.1.1

    Students write a question that compares two groups, like "Do boys and girls in our school prefer different sports?" then plan how to collect real data from a sample of people, keeping in mind that backgrounds and culture shape what questions make sense to ask.

  • Describe how statistics can be used to gain information about a population by…

    7.1.1.2

    To learn about a large group, students study a smaller sample. They explain why the sample needs to reflect the whole group and why picking people randomly gives more trustworthy results than handpicking them.

  • Make inferences using statistics about population parameters based on a random…

    7.1.1.3

    Students pick a small random sample, like surveying 50 kids in a school, then use what they find to draw reasonable conclusions about the whole group.

  • Understand that a set of data collected to answer a statistical question has a…

    7.1.1.4

    Students collect real data to answer a question, then use averages and spread to compare two groups. They explain why those numbers are the right tools for what they measured.

  • Create a visualization about a data set, organizing and presenting the data in…

    7.1.1.5

    Students pick the right type of chart or graph for their data, then build it carefully so the numbers tell a clear story to anyone reading it.

  • Compare and communicate competing explanations for data trends observed…

    7.1.1.6

    Students look at the same data set and explain why two people might read it differently, factoring in who collected it and how. They practice defending one interpretation while considering whether another is just as reasonable.

  • Calculate probability as a fraction of sample space or as a fraction of area

    7.1.2.1

    Students find the chance of something happening by comparing favorable outcomes to all possible outcomes. They write that chance as a fraction, a decimal, or a percent.

  • Approximate the probability of a chance event, where the theoretical…

    7.1.2.2

    Students collect real data from repeated trials to estimate how likely an event is to happen. They express that likelihood as a fraction, decimal, or percentage, then use it to make predictions.

  • Recognize that, just as with simple events, the probability of a compound event…

    7.1.2.3

    Compound events combine two or more simple events, like flipping a coin and rolling a die. Students find the probability by counting how many outcomes in the full list match what they're looking for, then writing that as a fraction.

  • Represent sample spaces for compound events by decomposing the events using…

    7.1.2.4

    Students list every possible outcome for two combined events, such as flipping a coin and rolling a die, using a table or branching diagram. Then they identify which outcomes match the event they are studying.

  • Design and use a simulation within a computational tool to generate frequencies…

    7.1.2.5

    Students set up a computer simulation to run a compound event (like flipping a coin and rolling a die) many times, then use the results to estimate how likely each outcome is.

  • Find probabilities of compound events using organized lists, tables, tree…

    7.1.2.6

    Students find the chances of two or more events happening together, such as flipping a coin and rolling a number cube at the same time. They use lists, tables, or branching diagrams to count all the possible outcomes.

Spatial Reasoning
  • Demonstrate an understanding of the proportional relationship between the…

    7.2.3.1

    Students learn that a circle's distance around is always a little more than 3 times its width across the middle. That ratio never changes for any circle, and the number describing it is called pi.

  • Calculate the circumference and area of circles to solve situations in various…

    7.2.3.2

    Students calculate the distance around a circle and the space inside it, then use those numbers to solve real problems. They practice picking the right formula and checking whether their answer makes sense.

  • Calculate the arc length and area of sectors of circles

    7.2.3.3

    Given a slice of a circle and its center angle, students calculate how long the curved edge is and how much area the slice covers.

  • Calculate the surface area and volume of cylinders

    7.2.3.4

    Students find the surface area and volume of cylinders using formulas, then explain in words why those formulas work.

  • Graph and describe translations and reflections of figures on a coordinate grid

    7.2.4.1

    Students slide or flip a shape on a coordinate grid and find the new corner points. They also explain why the moved shape stays exactly the same size and form as the original.

  • Describe the properties of similarity, distinguishing between similarity and…

    7.2.4.2

    Students compare two shapes to decide if they are similar (same shape, different size) or congruent (exact copies), then find the scale factor that shows how much one was stretched or shrunk to match the other.

  • Apply scale factors, length ratios and area ratios to determine side lengths…

    7.2.4.3

    Students use a scale factor to find the missing side lengths and areas of two shapes that look the same but are different sizes, like a small triangle and a blown-up version of it.

  • Use proportional reasoning and ratios to solve situations involving scale…

    7.2.4.4

    Students use ratios to read scale drawings, such as a map or a blueprint, and to convert between units like inches and centimeters. A small measurement on paper stands for a much larger real-world distance.

Patterns and Relationships
  • Know that every rational number can be written as the ratio of two integers and…

    7.3.5.1

    Every fraction and whole number can be written as a decimal that either stops or repeats a pattern. Pi (3.14159...) is different: its decimal never stops or repeats, so students learn to use 3.14 as a close-enough stand-in.

  • Recognize opposite signs of numbers as indicating locations on opposite sides…

    7.3.5.2

    On a number line, negative and positive versions of the same number sit on opposite sides of zero. Students learn that flipping a number's sign twice brings you back to where you started, and that zero is the one number with no opposite.

  • Compare positive and negative rational numbers expressed in various forms using…

    7.3.5.3

    Students compare positive and negative numbers, whether written as fractions, decimals, or whole numbers, using symbols like < and > to show which is larger or smaller.

  • Recognize subtraction of rational numbers as adding the additive inverse, 𝑝𝑝…

    7.3.5.4

    Subtracting a number is the same as adding its opposite. Students use this idea to find the distance between two numbers on a number line, such as the gap between -3 and 5.

  • Create a budget using positive and negative rational numbers for an event and…

    7.3.5.5

    Students build a budget for a real event, sorting money into categories like food or decorations. They use positive and negative numbers to track spending, then calculate what percentage of the total each category takes up.

  • Solve mathematical situations involving adding, subtracting, multiplying and…

    7.3.5.6

    Students add, subtract, multiply, and divide positive and negative numbers, including fractions and decimals. They also practice raising a number to a whole-number exponent, like 3 to the power of 4.

  • Compute unit rates associated with ratios of fractions, including ratios of…

    7.3.5.7

    Students find unit rates when both numbers in a ratio are fractions, such as miles per hour when distance and time are each given as a fraction. This builds on basic ratios by adding a fraction layer to the division.

  • Use properties of algebra to generate equivalent numerical and algebraic…

    7.3.6.1

    Students rearrange and rewrite math expressions, using rules like the distributive property, to create equivalent forms. The numbers may include fractions, decimals, parentheses, and exponents, but the value stays the same no matter how the expression is written.

  • Represent and solve contextual situations resulting in two-step equations and…

    7.3.6.2

    Students write and solve two-step equations and inequalities using positive and negative numbers from real-life situations. They plot the answers on a number line and explain what those answers mean in context.

  • Evaluate algebraic expressions, including expressions containing rational…

    7.3.6.3

    Plug a number in for the variable, then follow the order of operations (exponents first, then multiplication and division, then addition and subtraction) to find the value of the expression. Rational numbers and absolute value may be part of the calculation.

  • Solve multi-step situations involving proportional relationships in numerous…

    7.3.6.4

    Students use tables, diagrams, or equations to solve real-world problems where two quantities scale together, like comparing prices per item or mixing a recipe for a larger group.

  • Solve multi-step financial literacy situations including simple interest, tax…

    7.3.6.5

    Students calculate real-world money problems: interest on a loan, sales tax on a purchase, a tip at a restaurant, or a discount on a sale price. They work backward and forward to find the total, the missing piece, or the percent.

  • Represent proportional relationships with tables, verbal descriptions, symbols…

    7.3.7.1

    Students learn to show the same proportional relationship as a table, an equation, and a graph, then switch between them. They also find the unit rate hiding in each representation.

  • Express a relationship between two variables, the independent

    7.3.7.2

    Students learn to spot proportional relationships, where one variable is always a fixed multiple of the other. They also learn to tell the difference between relationships that are proportional and those that aren't, using tables, graphs, and equations.

  • Determine whether two quantities are in a proportional relationship by testing…

    7.3.7.3

    Students check whether two quantities grow at the same rate by looking for matching ratios in a table or by plotting points on a graph to see if they form a straight line through zero.

Assessments
The state tests students at this grade and subject take.
State Summative

Minnesota Comprehensive Assessment: Mathematics

Standards-based mathematics assessment for grades 3 through 8 and grade 11, aligned to Minnesota Academic Standards.

When given:
spring
Frequency:
annual
Official source
Alternate assessment

MTAS / Alternate MCA

Alternate standards-based assessment for eligible students with the most significant cognitive disabilities, administered in the same subjects and grades as the MCA program.

When given:
spring
Frequency:
annual
Official source
Common Questions
  • What math should students be doing by the end of the year?

    Students should work confidently with positive and negative numbers, including fractions and decimals. They should solve percent problems like tax, tips, and discounts, work with proportions and scale, find circle measurements, and use samples of data to make predictions.

  • How can I help at home when percent problems come up?

    Use real receipts and price tags. Ask students to figure out the tip at a restaurant, the sale price after a discount, or the tax on a purchase. Five minutes of this once a week builds the skill faster than worksheets.

  • Why is so much time spent on negative numbers this year?

    Negative numbers show up everywhere from here on: temperatures, bank accounts, elevation, and later algebra. Students need to add, subtract, multiply, and divide them without slowing down. A simple number line at home helps when subtraction with negatives gets confusing.

  • What usually needs the most reteaching?

    Operations with negative fractions and decimals trip up most students, especially subtraction. Proportional reasoning is the other sticking point. Students can often set up a proportion but lose track of what the unit rate means in context. Build in spiral review on both.

  • How should proportional reasoning be sequenced across the year?

    Start with tables and unit rates in plain contexts like price per item or miles per hour. Move to graphs and equations once students can spot the constant of proportionality in any representation. Save scale drawings, percent problems, and circle relationships for after that foundation is solid.

  • My student says they hate word problems. What helps?

    Most word problems this year are really about proportions or percents in disguise. Ask students to say in their own words what is being compared before touching the numbers. Cooking, shopping, and sports stats all give low-pressure practice.

  • What does mastery of circles look like by spring?

    Students should know that circumference divided by diameter is always pi, and use that to find circumference, area, arc length, and sector area in real contexts. They should also handle surface area and volume of cylinders and explain where the formulas come from.

  • How is data and probability different from earlier grades?

    Students move from describing one data set to comparing two groups using samples. They also work with compound events, like rolling two dice, using lists, tables, tree diagrams, and simulations. The focus is on what a sample can fairly tell about a larger population.

  • How do I know a student is ready for eighth-grade math?

    Look for fluent work with signed rational numbers, solid two-step equations and inequalities, and proportional reasoning across tables, graphs, and equations. Students should also handle percent problems in financial contexts without a formula sheet. If those are shaky, shore them up before linear functions arrive.