Real numbers and square roots
Students stretch beyond fractions and decimals to work with square roots and other numbers that never end. They learn to estimate, compare, and place these numbers on a number line.
This is the year math shifts from arithmetic to real algebra. Students graph lines, write equations like y = mx + b, and solve multi-step problems with a variable on both sides. They also meet the Pythagorean theorem and start working with square roots and other numbers that don't fit neatly on a fraction. By spring, students can graph a line from an equation and solve a word problem that takes several steps.
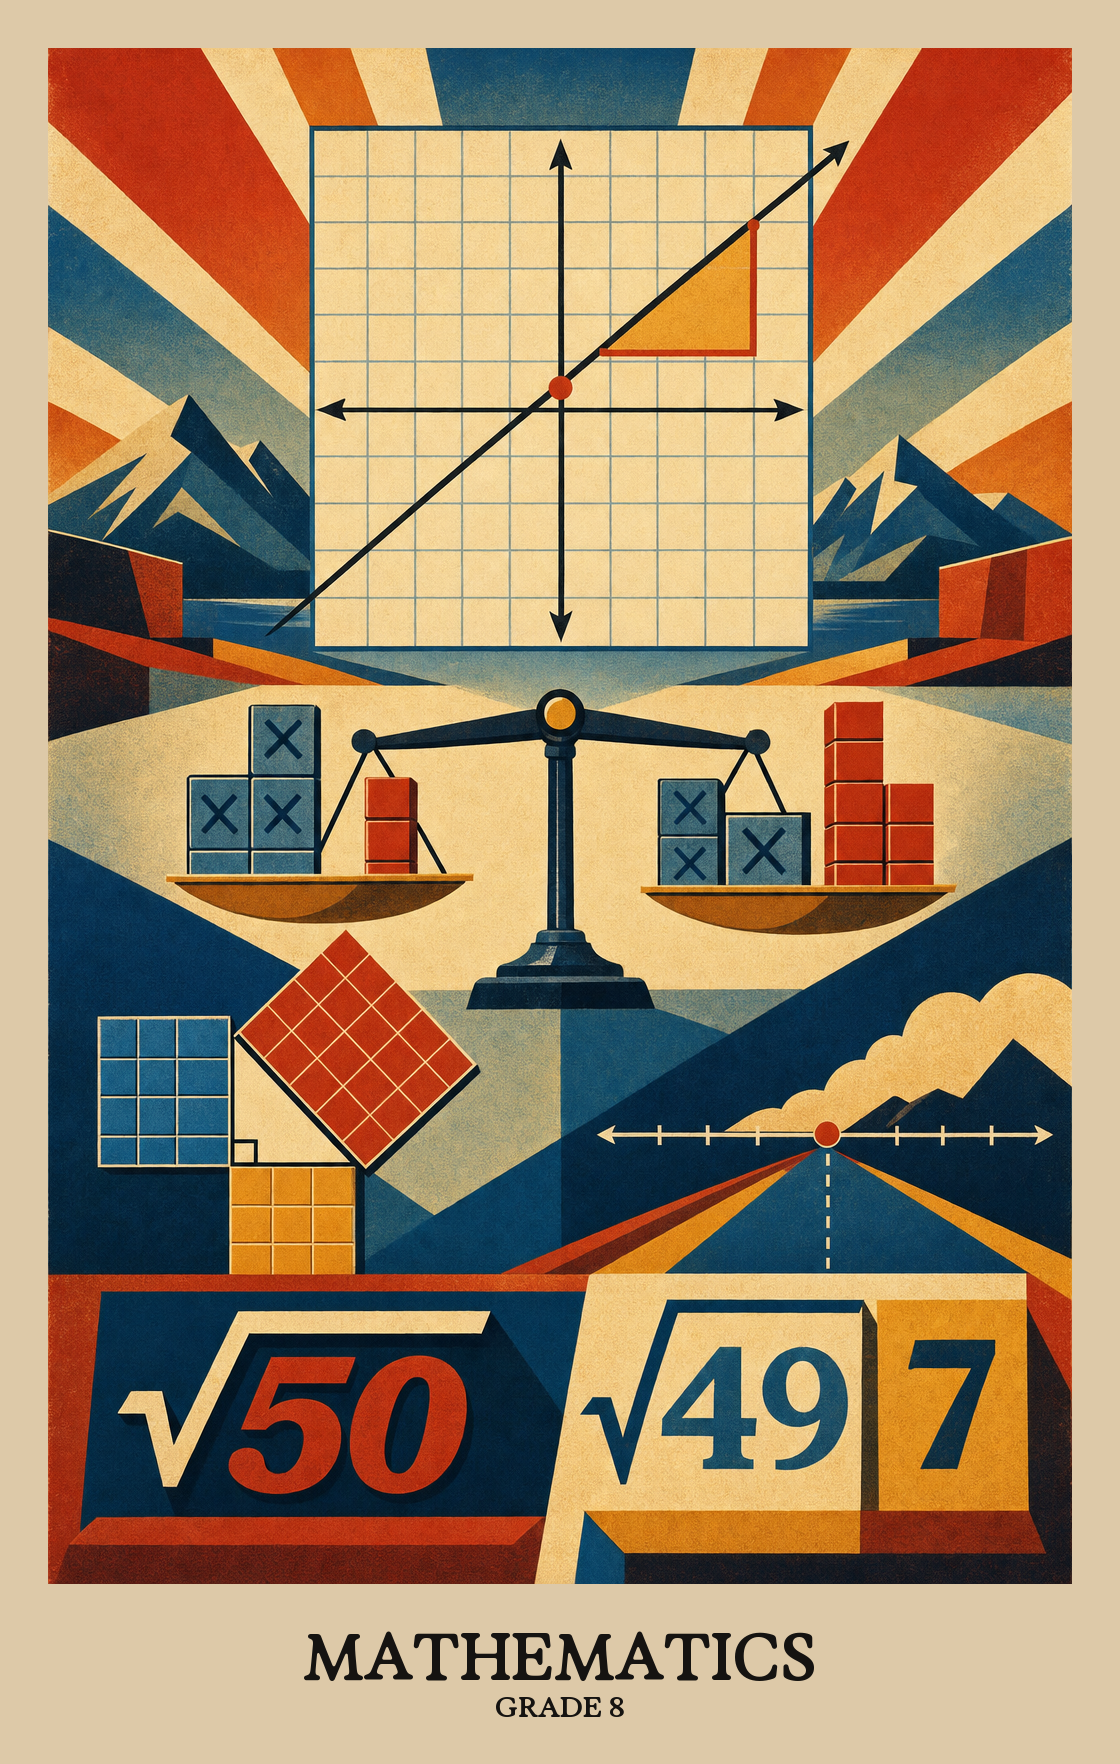
Students stretch beyond fractions and decimals to work with square roots and other numbers that never end. They learn to estimate, compare, and place these numbers on a number line.
Students figure out discounts, sales tax, tips, and percent change. Expect homework that looks a lot like a receipt or a price tag.
Students simplify expressions with variables and solve equations and inequalities that take several steps. They also translate word problems into equations and check that the answers make sense.
Students learn what a function is and start working with straight-line graphs. They move between a table, an equation like y = mx + b, a graph, and a real situation.
Students use angle relationships to find missing measures and apply the Pythagorean Theorem to right triangles. They also find surface area and volume of pyramids and cones, and slide and flip shapes on a coordinate grid.
Students find the probability of two events happening in a row and look at how replacing an item changes the odds. They also build boxplots and scatterplots to spot patterns in a set of data.
Students sort and rank real numbers, including fractions, decimals, square roots, and negative numbers, by placing them on a number line or comparing their values directly.
Students find which two whole numbers a square root falls between. For example, the square root of 50 sits between 7 and 8, and students explain which whole number is the closer estimate.
Students find decimal approximations for square roots like the square root of 50, then use those decimals to place the values in order or mark them on a number line. Results are rounded to the nearest hundredth.
Students line up a mix of numbers in order from smallest to largest (or largest to smallest). The set can include fractions, decimals, percents, square roots, and numbers in scientific notation, and students explain how they figured out the order.
Real numbers break into groups: whole numbers, integers, fractions, and irrational numbers like pi. Students map out how those groups relate and nest inside each other.
Students sort numbers into groups: natural numbers, whole numbers, integers, rational numbers, and irrational numbers. They show how those groups nest inside each other using diagrams or number lines.
Students sort numbers like fractions, square roots, and repeating decimals into the correct category (natural, integer, rational, or irrational) and explain why each one belongs there.
Real numbers split into named subsets: whole numbers, integers, rational numbers, and irrational numbers. Students describe what belongs in each group and what does not, explaining why a number like the square root of 2 is irrational but 0.5 is not.
| Standard | Definition | Code |
|---|---|---|
| The student will compare and order real numbers and determine the… | Students sort and rank real numbers, including fractions, decimals, square roots, and negative numbers, by placing them on a number line or comparing their values directly. | 8.NS.1 |
| Estimate and identify the two consecutive natural numbers between which the… | Students find which two whole numbers a square root falls between. For example, the square root of 50 sits between 7 and 8, and students explain which whole number is the closer estimate. | 8.NS.1.a |
| Use rational approximations | Students find decimal approximations for square roots like the square root of 50, then use those decimals to place the values in order or mark them on a number line. Results are rounded to the nearest hundredth. | 8.NS.1.b |
| Use multiple strategies | Students line up a mix of numbers in order from smallest to largest (or largest to smallest). The set can include fractions, decimals, percents, square roots, and numbers in scientific notation, and students explain how they figured out the order. | 8.NS.1.c |
| The student will investigate and describe the relationship between the subsets… | Real numbers break into groups: whole numbers, integers, fractions, and irrational numbers like pi. Students map out how those groups relate and nest inside each other. | 8.NS.2 |
| Describe and illustrate the relationships among the subsets of the real number… | Students sort numbers into groups: natural numbers, whole numbers, integers, rational numbers, and irrational numbers. They show how those groups nest inside each other using diagrams or number lines. | 8.NS.2.a |
| Classify and explain why a given number is a member of a particular subset or… | Students sort numbers like fractions, square roots, and repeating decimals into the correct category (natural, integer, rational, or irrational) and explain why each one belongs there. | 8.NS.2.b |
| Describe each subset of the set of real numbers and include examples and… | Real numbers split into named subsets: whole numbers, integers, rational numbers, and irrational numbers. Students describe what belongs in each group and what does not, explaining why a number like the square root of 2 is irrational but 0.5 is not. | 8.NS.2.c |
Students use ratios and percentages to solve real problems, like figuring out a sale price or scaling a recipe. When an exact answer isn't needed, they estimate to check whether their work makes sense.
Students figure out the sale price of an item after a store marks it up or marks it down. They estimate first, then calculate the exact discount or markup to find what the customer actually pays.
Students calculate sales tax and tips on real purchases, then find the total cost. This is the math behind every restaurant bill and shopping receipt.
Students figure out how much something went up or down as a percentage. They work through real situations like a price change or a test score shift, estimating first and then solving.
| Standard | Definition | Code |
|---|---|---|
| The student will estimate and apply proportional reasoning and… | Students use ratios and percentages to solve real problems, like figuring out a sale price or scaling a recipe. When an exact answer isn't needed, they estimate to check whether their work makes sense. | 8.CE.1 |
| Estimate and solve contextual problems that require the computation of one… | Students figure out the sale price of an item after a store marks it up or marks it down. They estimate first, then calculate the exact discount or markup to find what the customer actually pays. | 8.CE.1.a |
| Estimate and solve contextual problems that require the computation of the… | Students calculate sales tax and tips on real purchases, then find the total cost. This is the math behind every restaurant bill and shopping receipt. | 8.CE.1.b |
| Estimate and solve contextual problems that require the computation of the… | Students figure out how much something went up or down as a percentage. They work through real situations like a price change or a test score shift, estimating first and then solving. | 8.CE.1.c |
When two lines cross or meet, they form special angle pairs. Students identify those pairs (like angles that add up to 90 degrees or 180 degrees) and explain what makes each relationship different.
Given two or more angles, students figure out the missing angle measure by using what they know about angle pairs: supplementary angles add to 180 degrees, complementary angles add to 90 degrees, and vertical angles are equal.
Students find the total area covering the outside of a pyramid, then calculate how much space fits inside a cone or pyramid. Both skills use formulas that connect a shape's base and height.
Students find the total area covering a square-based pyramid, including its base and all four triangular sides. They use physical models, unfolded diagrams, and formulas to calculate that measurement.
Students find the volume of cones and square-based pyramids by working with physical models, diagrams, and formulas. They calculate how much space fits inside each shape.
Students explore why a cone holds exactly one-third the water a cylinder does at the same size, and why a square pyramid holds one-third the volume of a box with the same base and height.
Students use formulas to find how much space a cone or square-based pyramid takes up inside, and how much surface wraps around the outside of a pyramid. Problems are set in real-world situations, not just on paper.
Students move and flip shapes on a grid. They track the new position of each corner after sliding a shape left, right, up, or down, or flipping it across a line.
Students find the new corner points of a shape after sliding it up, down, left, right, or diagonally on a grid. The shape stays the same size and direction; only its position changes.
Students find where a shape lands after it flips across the horizontal or vertical axis on a grid, then record the new corner points using coordinates.
Students find the new corner points of a shape after sliding it across a grid, flipping it over a horizontal or vertical line, or doing both moves in order.
Students slide a shape up, down, left, right, or diagonally on a grid and draw where it lands. The shape stays the same size and angle; it just moves to a new position.
Students flip a shape across one of the gridlines on a coordinate plane and sketch where it lands. The new shape is a mirror image of the original, the same size, just on the opposite side.
Students sketch where a shape lands after sliding it across a grid and flipping it over a horizontal or vertical axis. The two moves can happen in either order.
Students spot translations and reflections in real-world patterns like floor tiles, fabric prints, or wallpaper designs, then explain which transformation was used and how it moves or flips the shape.
Students use the rule that the two shorter sides of a right triangle determine the length of the longest side. They apply that rule to real problems, like finding a diagonal distance or the height of a ramp.
Students check that the Pythagorean Theorem actually works by drawing right triangles, measuring the sides, and confirming the math holds up. The goal is to see why the rule is true, not just memorize it.
Given three side lengths, students decide whether those measurements form a right triangle by checking if the numbers satisfy the Pythagorean Theorem.
Students look at a right triangle drawn in different positions and correctly name which side is the hypotenuse and which sides are the legs. The triangle may be tilted or flipped, but the names stay the same.
Given two sides of a right triangle, students find the length of the missing side using the Pythagorean Theorem. This applies to triangles on paper and to real-world situations like finding the diagonal distance across a rectangular room.
Students use the rule that connects the three sides of a right triangle to find a missing length in a real-world situation, such as the height of a ramp or the diagonal of a room. They also work backward to check whether a triangle is actually a right triangle.
Students find the area and perimeter of shapes made by combining simpler figures, like rectangles joined to triangles. Problems are often set in real-world contexts, such as a floor plan or a yard.
Students break an irregular shape into familiar pieces like triangles, rectangles, and circles, find the area of each piece, then add them together to get the total area.
Students break an irregular shape into familiar pieces like triangles, rectangles, and half-circles, then add up the outer edge lengths to find the total perimeter.
Students find the perimeter or area of shapes built by combining simpler figures, like rectangles merged with semicircles. They use the right formula for each part, then add the pieces together to solve a real-world problem.
| Standard | Definition | Code |
|---|---|---|
| Identify and describe the relationship between pairs of angles that are… | When two lines cross or meet, they form special angle pairs. Students identify those pairs (like angles that add up to 90 degrees or 180 degrees) and explain what makes each relationship different. | 8.MG.1.a |
| Use the relationships among supplementary, complementary, vertical | Given two or more angles, students figure out the missing angle measure by using what they know about angle pairs: supplementary angles add to 180 degrees, complementary angles add to 90 degrees, and vertical angles are equal. | 8.MG.1.b |
| The student will investigate and determine the surface area of square-based… | Students find the total area covering the outside of a pyramid, then calculate how much space fits inside a cone or pyramid. Both skills use formulas that connect a shape's base and height. | 8.MG.2 |
| Determine the surface area of square-based pyramids by using concrete objects… | Students find the total area covering a square-based pyramid, including its base and all four triangular sides. They use physical models, unfolded diagrams, and formulas to calculate that measurement. | 8.MG.2.a |
| Determine the volume of cones and square-based pyramids, using concrete… | Students find the volume of cones and square-based pyramids by working with physical models, diagrams, and formulas. They calculate how much space fits inside each shape. | 8.MG.2.b |
| Examine and explain the relationship between the volume of cones and cylinders | Students explore why a cone holds exactly one-third the water a cylinder does at the same size, and why a square pyramid holds one-third the volume of a box with the same base and height. | 8.MG.2.c |
| Solve problems in context involving volume of cones and square-based pyramids… | Students use formulas to find how much space a cone or square-based pyramid takes up inside, and how much surface wraps around the outside of a pyramid. Problems are set in real-world situations, not just on paper. | 8.MG.2.d |
| The student will apply translations and reflections to polygons in the… | Students move and flip shapes on a grid. They track the new position of each corner after sliding a shape left, right, up, or down, or flipping it across a line. | 8.MG.3 |
| Given a preimage in the coordinate plane, identify the coordinates of the image… | Students find the new corner points of a shape after sliding it up, down, left, right, or diagonally on a grid. The shape stays the same size and direction; only its position changes. | 8.MG.3.a |
| Given a preimage in the coordinate plane, identify the coordinates of the image… | Students find where a shape lands after it flips across the horizontal or vertical axis on a grid, then record the new corner points using coordinates. | 8.MG.3.b |
| Given a preimage in the coordinate plane, identify the coordinates of the image… | Students find the new corner points of a shape after sliding it across a grid, flipping it over a horizontal or vertical line, or doing both moves in order. | 8.MG.3.c |
| Sketch the image of a polygon that has been translated vertically, horizontally | Students slide a shape up, down, left, right, or diagonally on a grid and draw where it lands. The shape stays the same size and angle; it just moves to a new position. | 8.MG.3.d |
| Sketch the image of a polygon that has been reflected over the x- or y-axis | Students flip a shape across one of the gridlines on a coordinate plane and sketch where it lands. The new shape is a mirror image of the original, the same size, just on the opposite side. | 8.MG.3.e |
| Sketch the image of a polygon that has been translated and reflected over the… | Students sketch where a shape lands after sliding it across a grid and flipping it over a horizontal or vertical axis. The two moves can happen in either order. | 8.MG.3.f |
| Identify and describe transformations in context | Students spot translations and reflections in real-world patterns like floor tiles, fabric prints, or wallpaper designs, then explain which transformation was used and how it moves or flips the shape. | 8.MG.3.g |
| The student will apply the Pythagorean Theorem to solve problems involving… | Students use the rule that the two shorter sides of a right triangle determine the length of the longest side. They apply that rule to real problems, like finding a diagonal distance or the height of a ramp. | 8.MG.4 |
| Verify the Pythagorean Theorem using diagrams, concrete materials | Students check that the Pythagorean Theorem actually works by drawing right triangles, measuring the sides, and confirming the math holds up. The goal is to see why the rule is true, not just memorize it. | 8.MG.4.a |
| Determine whether a triangle is a right triangle given the measures of its… | Given three side lengths, students decide whether those measurements form a right triangle by checking if the numbers satisfy the Pythagorean Theorem. | 8.MG.4.b |
| Identify the parts of a right triangle | Students look at a right triangle drawn in different positions and correctly name which side is the hypotenuse and which sides are the legs. The triangle may be tilted or flipped, but the names stay the same. | 8.MG.4.c |
| Determine the measure of a side of a right triangle, given the measures of the… | Given two sides of a right triangle, students find the length of the missing side using the Pythagorean Theorem. This applies to triangles on paper and to real-world situations like finding the diagonal distance across a rectangular room. | 8.MG.4.d |
| Apply the Pythagorean Theorem | Students use the rule that connects the three sides of a right triangle to find a missing length in a real-world situation, such as the height of a ramp or the diagonal of a room. They also work backward to check whether a triangle is actually a right triangle. | 8.MG.4.e |
| The student will solve area and perimeter problems involving composite plane… | Students find the area and perimeter of shapes made by combining simpler figures, like rectangles joined to triangles. Problems are often set in real-world contexts, such as a floor plan or a yard. | 8.MG.5 |
| Subdivide a plane figure into triangles, rectangles, squares, trapezoids… | Students break an irregular shape into familiar pieces like triangles, rectangles, and circles, find the area of each piece, then add them together to get the total area. | 8.MG.5.a |
| Subdivide a plane figure into triangles, rectangles, squares, trapezoids… | Students break an irregular shape into familiar pieces like triangles, rectangles, and half-circles, then add up the outer edge lengths to find the total perimeter. | 8.MG.5.b |
| Apply perimeter, circumference | Students find the perimeter or area of shapes built by combining simpler figures, like rectangles merged with semicircles. They use the right formula for each part, then add the pieces together to solve a real-world problem. | 8.MG.5.c |
Students figure out how likely two events are to happen, whether one affects the other or not. They work through real-world problems, like drawing cards or picking names, to calculate those chances.
Students decide whether two events affect each other's odds, such as drawing a card and putting it back versus keeping it out. Replacing an item resets the odds; not replacing it changes what's left.
Students learn the difference between two types of chance events: ones where the first result doesn't change what comes next, and ones where it does. Think of drawing cards from a deck without putting them back.
Students figure out the chance that two unrelated events both happen, such as flipping heads on a coin and rolling a six on a die. The result of one event does not change the odds of the other.
Two events are dependent when the first outcome changes the odds of the second. Students calculate the probability of both happening, such as drawing two specific cards from a deck without replacing the first.
Students gather data, sort it, and display it in a boxplot, which splits numbers into four equal groups to show the spread. Then students explain what the boxplot reveals about the data.
Students come up with a question worth investigating, such as "How long do students in our school sleep each night?" with a plan to display the results in a boxplot.
Students decide what information they need to answer a question they came up with, then gather that information by observing, measuring, surveying, or running an experiment.
Students learn to spot when a survey or sample is skewed, such as only asking one group of people, and explain why that makes the results unreliable for describing everyone.
Students take a set of up to 20 numbers, find the median, quartiles, and min and max values, then draw a boxplot to show how the data is spread out.
Reading a boxplot means finding its five key values: the lowest number, the highest number, the middle value, and the two middle-split points. From those, students calculate the full spread and the spread of the middle half.
Students learn what happens to a boxplot when one value is far outside the rest. An outlier can stretch one side of the box, shift the median, and make the data look more spread out than it really is.
Reading a boxplot, students identify the median, spread, and any skew in a data set, then draw a conclusion about what the numbers show.
Students look at two boxplots side by side and draw conclusions about how the groups differ, such as which has a wider spread or a higher middle value.
Given a set of data, students explain why one type of chart or graph shows the information more clearly than another, such as choosing a boxplot to show a spread of test scores instead of a bar graph.
Students learn to spot tricks in charts and graphs, like a scale that skips numbers or a bar that starts above zero, that make data look more dramatic than it really is.
Students gather real data, plot it on a scatterplot, and look for patterns. They then draw conclusions and explain what the graph shows.
Students come up with a question whose answer requires gathering two sets of numbers and plotting them together, such as "Does more study time lead to higher test scores?"
Students pick the right kind of data to answer a question they wrote, then gather up to 20 data points by observing, measuring, surveying, or running a simple experiment.
Students take two sets of numbers collected together (like hours studied and test scores) and plot each pair as a dot on a graph to see if a pattern or trend appears.
A scatterplot shows how two things relate. Students look at the dot pattern and decide whether the two values rise together, move in opposite directions, or show no connection at all.
Students look at a scatterplot and explain what the pattern of dots actually means, such as whether two things tend to rise and fall together or show no clear connection.
Students draw a straight line through a scatterplot that best follows the pattern of the dots. The line doesn't need to touch every point; it shows the general direction the data is heading.
| Standard | Definition | Code |
|---|---|---|
| The student will use statistical investigation to determine the probability of… | Students figure out how likely two events are to happen, whether one affects the other or not. They work through real-world problems, like drawing cards or picking names, to calculate those chances. | 8.PS.1 |
| Determine whether two events are independent or dependent and explain how… | Students decide whether two events affect each other's odds, such as drawing a card and putting it back versus keeping it out. Replacing an item resets the odds; not replacing it changes what's left. | 8.PS.1.a |
| Compare and contrast the probability of independent and dependent events | Students learn the difference between two types of chance events: ones where the first result doesn't change what comes next, and ones where it does. Think of drawing cards from a deck without putting them back. | 8.PS.1.b |
| Determine the probability of two independent events | Students figure out the chance that two unrelated events both happen, such as flipping heads on a coin and rolling a six on a die. The result of one event does not change the odds of the other. | 8.PS.1.c |
| Determine the probability of two dependent events | Two events are dependent when the first outcome changes the odds of the second. Students calculate the probability of both happening, such as drawing two specific cards from a deck without replacing the first. | 8.PS.1.d |
| The student will apply the data cycle | Students gather data, sort it, and display it in a boxplot, which splits numbers into four equal groups to show the spread. Then students explain what the boxplot reveals about the data. | 8.PS.2 |
| Formulate questions that require the collection or acquisition of data with a… | Students come up with a question worth investigating, such as "How long do students in our school sleep each night?" with a plan to display the results in a boxplot. | 8.PS.2.a |
| Determine the data needed to answer a formulated question and collect the data | Students decide what information they need to answer a question they came up with, then gather that information by observing, measuring, surveying, or running an experiment. | 8.PS.2.b |
| Determine how statistical bias might affect whether the data collected from the… | Students learn to spot when a survey or sample is skewed, such as only asking one group of people, and explain why that makes the results unreliable for describing everyone. | 8.PS.2.c |
| Organize and represent a numeric data set of no more than 20 items, using… | Students take a set of up to 20 numbers, find the median, quartiles, and min and max values, then draw a boxplot to show how the data is spread out. | 8.PS.2.d |
| Identify and describe the lower extreme | Reading a boxplot means finding its five key values: the lowest number, the highest number, the middle value, and the two middle-split points. From those, students calculate the full spread and the spread of the middle half. | 8.PS.2.e |
| Describe how the presence of an extreme data point | Students learn what happens to a boxplot when one value is far outside the rest. An outlier can stretch one side of the box, shift the median, and make the data look more spread out than it really is. | 8.PS.2.f |
| Analyze data represented in a boxplot by making observations and drawing… | Reading a boxplot, students identify the median, spread, and any skew in a data set, then draw a conclusion about what the numbers show. | 8.PS.2.g |
| Compare and analyze two data sets represented in boxplots | Students look at two boxplots side by side and draw conclusions about how the groups differ, such as which has a wider spread or a higher middle value. | 8.PS.2.h |
| Given a contextual situation, justify which graphical representation | Given a set of data, students explain why one type of chart or graph shows the information more clearly than another, such as choosing a boxplot to show a spread of test scores instead of a bar graph. | 8.PS.2.i |
| Identify components of graphical displays that can be misleading | Students learn to spot tricks in charts and graphs, like a scale that skips numbers or a bar that starts above zero, that make data look more dramatic than it really is. | 8.PS.2.j |
| The student will apply the data cycle | Students gather real data, plot it on a scatterplot, and look for patterns. They then draw conclusions and explain what the graph shows. | 8.PS.3 |
| Formulate questions that require the collection or acquisition of data with a… | Students come up with a question whose answer requires gathering two sets of numbers and plotting them together, such as "Does more study time lead to higher test scores?" | 8.PS.3.a |
| Determine the data needed to answer a formulated question and collect the data | Students pick the right kind of data to answer a question they wrote, then gather up to 20 data points by observing, measuring, surveying, or running a simple experiment. | 8.PS.3.b |
| Organize and represent numeric bivariate data using scatterplots with and… | Students take two sets of numbers collected together (like hours studied and test scores) and plot each pair as a dot on a graph to see if a pattern or trend appears. | 8.PS.3.c |
| Make observations about a set of data points in a scatterplot as having a… | A scatterplot shows how two things relate. Students look at the dot pattern and decide whether the two values rise together, move in opposite directions, or show no connection at all. | 8.PS.3.d |
| Analyze and justify the relationship of the quantitative bivariate data… | Students look at a scatterplot and explain what the pattern of dots actually means, such as whether two things tend to rise and fall together or show no clear connection. | 8.PS.3.e |
| Sketch the line of best fit for data represented in a scatterplot | Students draw a straight line through a scatterplot that best follows the pattern of the dots. The line doesn't need to touch every point; it shows the general direction the data is heading. | 8.PS.3.f |
Simplifying and rewriting algebraic expressions with one variable, like combining like terms or factoring, so an expression means the same thing in a simpler form.
Students use tiles or chips to build algebraic expressions by hand, including ones where a number multiplies across a set of terms in parentheses. The goal is to see what the algebra actually looks like before working with symbols alone.
Students simplify algebraic expressions with one variable by combining like terms and using the distributive property. The expressions are linear, and the numbers involved can be fractions or decimals.
Students decide whether a set of paired values counts as a function, then identify its possible inputs (domain) and outputs (range). This is the foundation for reading and writing equations that describe real patterns.
Given a small set of points on a graph or in a table, students decide whether each input has exactly one output. That's the test for a function.
Given a list of coordinate pairs or a simple table, students find the complete set of x-values (domain) and the complete set of y-values (range) that appear in that function.
Students write equations for straight-line relationships, then use them to solve real problems. They read graphs, find where the line crosses the vertical axis, and explain what the slope and intercepts mean in context.
Students learn what happens to a straight line on a graph when a number is added to the equation. Shifting that number up or down moves the whole line without changing its slope.
Students identify the slope (how steep a line is), the y-intercept (where it crosses the vertical axis), and which variable drives the other in a linear function.
Students take a table of numbers or an equation and plot it as a straight line on a graph. The line shows how two quantities move together, such as miles driven and time passed.
Given a graph or equation, students build a table showing matching x and y value pairs. They practice moving between the picture of a line, its equation, and a list of coordinates that all tell the same story.
Given a graph, table, or word problem, students write the equation that describes a straight-line relationship using slope and starting value.
Given a graph, table, or equation, students write a real-world story that fits the pattern. For example, a line rising by 3 each step might describe someone earning $3 per hour starting with $5 in their pocket.
Students solve equations that take more than one step to unwind, like finding an unknown number when it's been multiplied, added to, and shifted around. They also set up and solve those equations from word problems.
Students set up and solve equations where a letter stands for an unknown number, working through up to four steps to find the answer. The unknown can appear on either side of the equals sign.
Students solve equations that take up to four steps to work through, using skills like distributing a number into parentheses and combining similar terms before finding the answer.
Students read a word problem and turn it into a multistep equation with one unknown. They figure out which quantities to combine, then write the equation before solving it.
Students read a multistep equation and write a real-world word problem that matches it. The story they create has to fit every step of the equation.
Students use a multistep equation to solve a real-world problem, like figuring out how many hours of work it takes to earn enough money for a purchase. They practice setting up and solving the equation from start to finish.
Students solve a multistep equation, then explain what the answer actually means in the real situation. If x equals 4, they say what those 4 units represent, not just circle the number.
After solving a linear equation, students check their answer by substituting it back into the original equation to confirm both sides are equal.
Students solve inequalities that take more than one step to work through, like finding the range of hours someone can work without exceeding a budget. They practice writing those inequalities from real situations and solving for all values that make them true.
Students solve inequalities with multiple steps, using the same properties as equation solving but flipping the inequality sign when multiplying or dividing by a negative number. Problems may require distributing or combining like terms first.
Students solve a multistep inequality and then show the answer two ways: as a math expression and as a shaded line on a number line graph.
Students read a word problem and write an inequality that shows a range of possible answers, like figuring out how many items you can buy without going over a budget. The inequality takes more than one step to build.
Given an inequality like 3x + 5 > 20, students write a real-world story problem that fits it. They work backward from the math to invent a situation where the inequality describes an actual constraint, like a budget or a distance.
Students solve real-world problems using inequalities with more than one step, such as finding how many hours to work to afford a purchase or how many items fit within a budget.
Students look at an inequality like x > 3 and decide whether a specific number fits. They check if a given value makes the inequality true.
Students solve a real-world inequality, then explain what the answer actually means. If x is greater than 3, they say what that looks like in the situation, not just on a number line.
| Standard | Definition | Code |
|---|---|---|
| The student will represent, simplify | Simplifying and rewriting algebraic expressions with one variable, like combining like terms or factoring, so an expression means the same thing in a simpler form. | 8.PFA.1 |
| Represent algebraic expressions using concrete manipulatives or pictorial… | Students use tiles or chips to build algebraic expressions by hand, including ones where a number multiplies across a set of terms in parentheses. The goal is to see what the algebra actually looks like before working with symbols alone. | 8.PFA.1.a |
| Simplify and generate equivalent algebraic expressions in one variable by… | Students simplify algebraic expressions with one variable by combining like terms and using the distributive property. The expressions are linear, and the numbers involved can be fractions or decimals. | 8.PFA.1.b |
| The student will determine whether a given relation is a function and determine… | Students decide whether a set of paired values counts as a function, then identify its possible inputs (domain) and outputs (range). This is the foundation for reading and writing equations that describe real patterns. | 8.PFA.2 |
| Determine whether a relation, represented by a set of ordered pairs, a table | Given a small set of points on a graph or in a table, students decide whether each input has exactly one output. That's the test for a function. | 8.PFA.2.a |
| Identify the domain and range of a function represented as a set of ordered… | Given a list of coordinate pairs or a simple table, students find the complete set of x-values (domain) and the complete set of y-values (range) that appear in that function. | 8.PFA.2.b |
| The student will represent and solve problems, including those in context, by… | Students write equations for straight-line relationships, then use them to solve real problems. They read graphs, find where the line crosses the vertical axis, and explain what the slope and intercepts mean in context. | 8.PFA.3 |
| Determine how adding a constant | Students learn what happens to a straight line on a graph when a number is added to the equation. Shifting that number up or down moves the whole line without changing its slope. | 8.PFA.3.a |
| Describe key characteristics of linear functions including slope | Students identify the slope (how steep a line is), the y-intercept (where it crosses the vertical axis), and which variable drives the other in a linear function. | 8.PFA.3.b |
| Graph a linear function given a table, equation | Students take a table of numbers or an equation and plot it as a straight line on a graph. The line shows how two quantities move together, such as miles driven and time passed. | 8.PFA.3.c |
| Create a table of values for a linear function given a graph, equation in the… | Given a graph or equation, students build a table showing matching x and y value pairs. They practice moving between the picture of a line, its equation, and a list of coordinates that all tell the same story. | 8.PFA.3.d |
| Write an equation of a linear function in the form y = mx + b, given a graph… | Given a graph, table, or word problem, students write the equation that describes a straight-line relationship using slope and starting value. | 8.PFA.3.e |
| Create a context for a linear function given a graph, table | Given a graph, table, or equation, students write a real-world story that fits the pattern. For example, a line rising by 3 each step might describe someone earning $3 per hour starting with $5 in their pocket. | 8.PFA.3.f |
| The student will write and solve multistep linear equations in one variable… | Students solve equations that take more than one step to unwind, like finding an unknown number when it's been multiplied, added to, and shifted around. They also set up and solve those equations from word problems. | 8.PFA.4 |
| Represent and solve multistep linear equations in one variable with the… | Students set up and solve equations where a letter stands for an unknown number, working through up to four steps to find the answer. The unknown can appear on either side of the equals sign. | 8.PFA.4.a |
| Apply properties of real numbers and properties of equality to solve multistep… | Students solve equations that take up to four steps to work through, using skills like distributing a number into parentheses and combining similar terms before finding the answer. | 8.PFA.4.b |
| Write a multistep linear equation in one variable to represent a verbal… | Students read a word problem and turn it into a multistep equation with one unknown. They figure out which quantities to combine, then write the equation before solving it. | 8.PFA.4.c |
| Create a verbal situation in context given a multistep linear equation in one… | Students read a multistep equation and write a real-world word problem that matches it. The story they create has to fit every step of the equation. | 8.PFA.4.d |
| Solve problems in context that require the solution of a multistep linear… | Students use a multistep equation to solve a real-world problem, like figuring out how many hours of work it takes to earn enough money for a purchase. They practice setting up and solving the equation from start to finish. | 8.PFA.4.e |
| Interpret algebraic solutions in context to linear equations in one variable | Students solve a multistep equation, then explain what the answer actually means in the real situation. If x equals 4, they say what those 4 units represent, not just circle the number. | 8.PFA.4.f |
| Confirm algebraic solutions to linear equations in one variable | After solving a linear equation, students check their answer by substituting it back into the original equation to confirm both sides are equal. | 8.PFA.4.g |
| The student will write and solve multistep linear inequalities in one variable… | Students solve inequalities that take more than one step to work through, like finding the range of hours someone can work without exceeding a budget. They practice writing those inequalities from real situations and solving for all values that make them true. | 8.PFA.5 |
| Apply properties of real numbers and properties of inequality to solve… | Students solve inequalities with multiple steps, using the same properties as equation solving but flipping the inequality sign when multiplying or dividing by a negative number. Problems may require distributing or combining like terms first. | 8.PFA.5.a |
| Represent solutions to inequalities algebraically and graphically using a… | Students solve a multistep inequality and then show the answer two ways: as a math expression and as a shaded line on a number line graph. | 8.PFA.5.b |
| Write multistep linear inequalities in one variable to represent a verbal… | Students read a word problem and write an inequality that shows a range of possible answers, like figuring out how many items you can buy without going over a budget. The inequality takes more than one step to build. | 8.PFA.5.c |
| Create a verbal situation in context given a multistep linear inequality in one… | Given an inequality like 3x + 5 > 20, students write a real-world story problem that fits it. They work backward from the math to invent a situation where the inequality describes an actual constraint, like a budget or a distance. | 8.PFA.5.d |
| Solve problems in context that require the solution of a multistep linear… | Students solve real-world problems using inequalities with more than one step, such as finding how many hours to work to afford a purchase or how many items fit within a budget. | 8.PFA.5.e |
| Identify a numerical value | Students look at an inequality like x > 3 and decide whether a specific number fits. They check if a given value makes the inequality true. | 8.PFA.5.f |
| Interpret algebraic solutions in context to linear inequalities in one variable | Students solve a real-world inequality, then explain what the answer actually means. If x is greater than 3, they say what that looks like in the situation, not just on a number line. | 8.PFA.5.g |
Standards of Learning mathematics assessment for grades 3 through 8.
Shorter computer-adaptive mathematics growth assessments for grades 3 through 8, administered during the school year in addition to spring SOL tests.
High school end-of-course mathematics assessments, including Algebra I, Geometry, and Algebra II.
Alternate assessment program for eligible students with significant cognitive disabilities, covering state-tested grades and subjects.
Federally administered sample-based assessment in reading, mathematics, science, writing, and other subjects. NAEP results inform state-by-state comparisons rather than individual student or school accountability.
Students work with the full real number system, including square roots and numbers like pi. They solve multistep equations and inequalities, graph straight lines from y = mx + b, use the Pythagorean Theorem, and study probability and data shown on boxplots and scatterplots.
Ask students to explain a problem out loud before solving it. When they get stuck, have them rewrite the problem on paper, label what is known, and circle what the question is asking. Five to ten minutes of talking through one problem helps more than redoing a whole worksheet.
Word problems get easier when students slow down and translate the sentence into math one piece at a time. At home, try real situations: a 20 percent off sale, a tip on a restaurant bill, or splitting a phone bill. Ask what equation would solve it before reaching for a calculator.
It is the rule that connects the three sides of a right triangle: the two short sides squared and added equal the long side squared. Students use it to find missing lengths, like the diagonal of a TV screen or the height of a ladder against a wall. It shows up often in eighth grade and again in high school geometry.
A common path is real numbers and square roots first, then expressions, equations, and inequalities, then linear functions and graphing. Geometry topics like angles, Pythagorean Theorem, and volume fit well in the middle or spring, with probability and data work spread across the year as shorter units.
Solving equations with variables on both sides, distributing a negative, and flipping the inequality sign when multiplying or dividing by a negative. Graphing from y = mx + b also takes repeated practice, especially reading slope as rise over run from a table or context.
Students can solve a four-step equation or inequality with rational numbers, write y = mx + b from a table, graph, or word problem, and use the Pythagorean Theorem on a right triangle in context. They can also read a boxplot or scatterplot and describe what the data shows.
Students should be comfortable solving multistep equations, graphing lines, and explaining what slope and y-intercept mean in a real situation. If they can set up and solve a word problem with one variable without panicking, they are in good shape for Algebra 1.
Yes. Eighth grade work moves quickly, and weak multiplication or fraction skills slow students down on every topic, from solving equations to finding slope. A few minutes of fact practice or fraction review each week pays off all year.