Fractions, decimals, and percents
Students see that one half, 0.5, and 50% are the same amount in different outfits. They compare and order these numbers and use them to talk about real things like sale prices and survey results.
Sixth grade is the year math stretches past whole numbers into the full number system. Students move fluidly between fractions, decimals, and percents, and they meet negative numbers on the number line for the first time. Ratios and unit rates show up, along with one-step equations that use a letter to stand in for an unknown. By spring, students can find the area of a circle, plot points in all four quadrants of a graph, and solve a simple equation like x + 7 = 12.
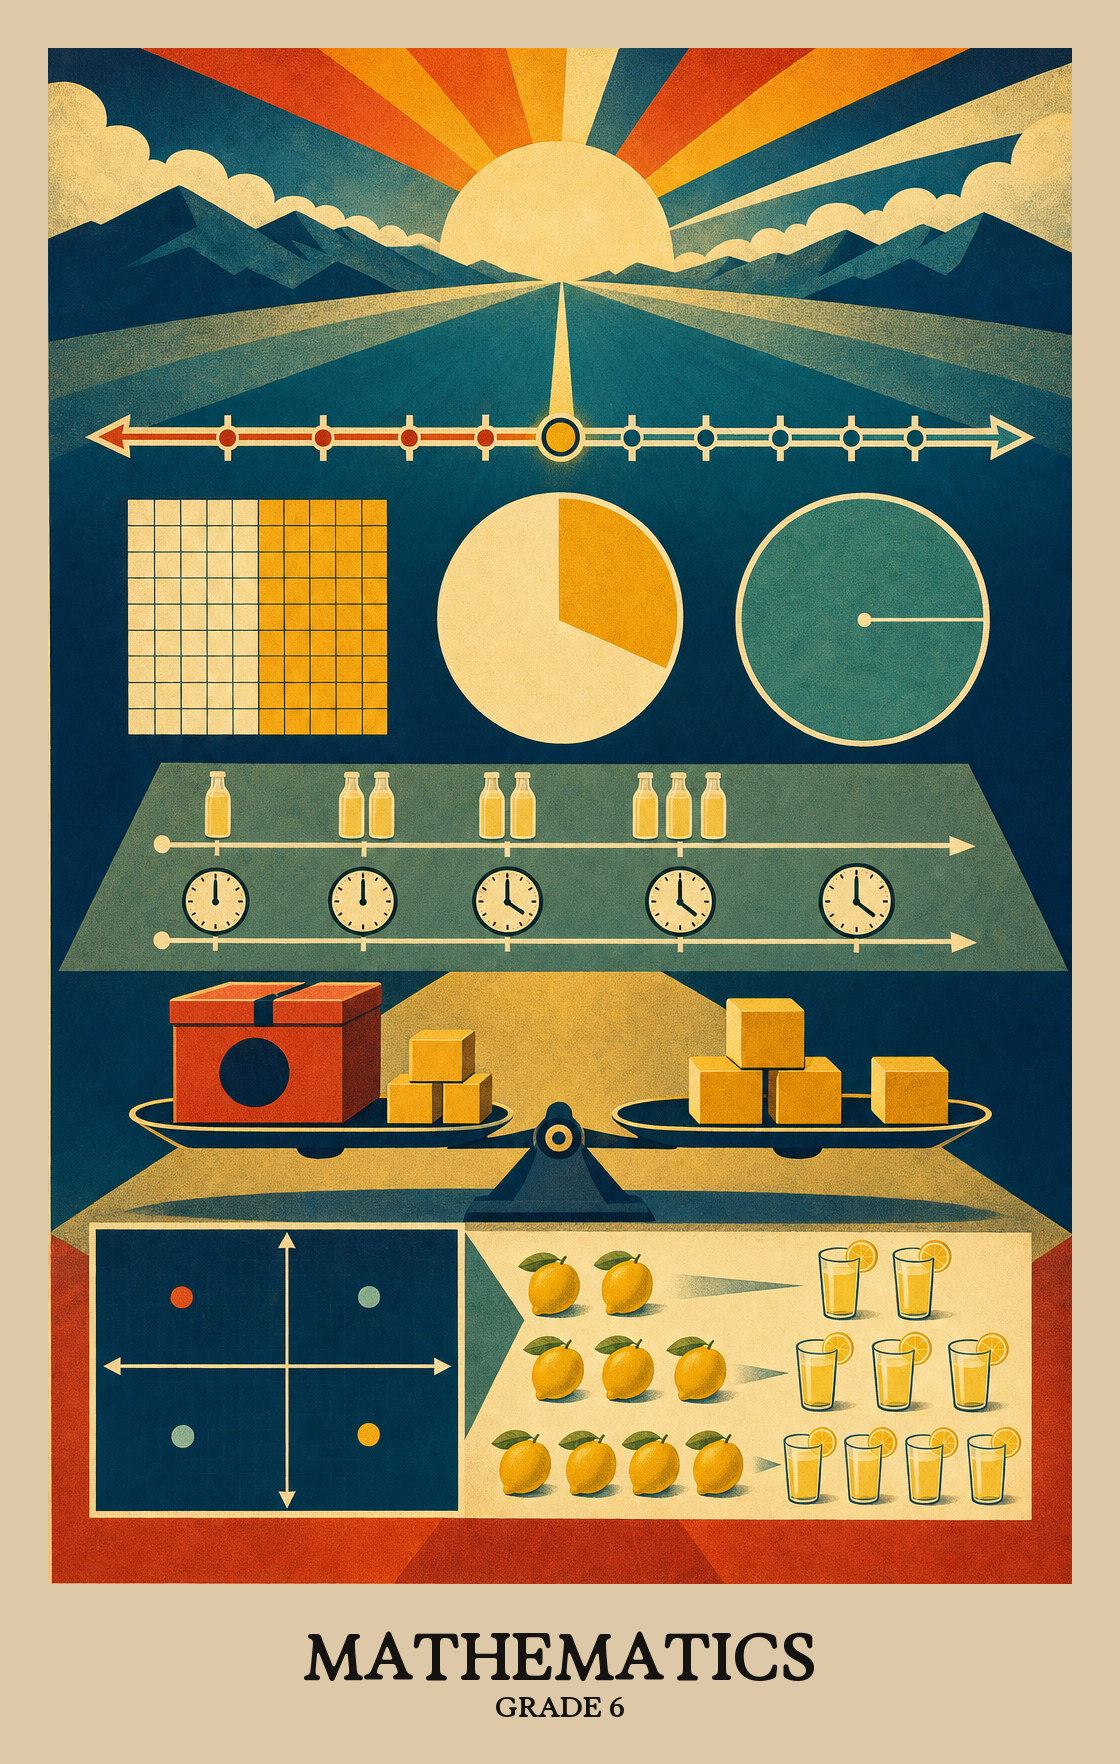
Students see that one half, 0.5, and 50% are the same amount in different outfits. They compare and order these numbers and use them to talk about real things like sale prices and survey results.
Students work with negative numbers for the first time, using a number line to compare temperatures, elevations, and money owed. They add, subtract, multiply, and divide positive and negative numbers and learn what absolute value means.
Students use ratios to compare amounts, like cups of flour to cups of sugar, and find unit rates such as price per ounce. They also write and solve simple equations with one unknown and graph inequalities on a number line.
Students discover where pi comes from and use it to find the distance around a circle and the space inside it. They also find the area of triangles and parallelograms and plot points in all four quadrants of a coordinate grid.
Students write repeated multiplication using exponents and recognize perfect squares. They build circle graphs from survey data, find the mean as a balance point, and notice how one unusual value can pull the average up or down.
Students compare and order fractions, mixed numbers, decimals, and percents by converting between forms to see which is larger or smaller. They use more than one method to show that different-looking numbers can be equal.
Students look at a model like a shaded grid or a number line and figure out what percent it shows, including amounts smaller than 1% or larger than 100%.
Students practice converting decimals like 0.375 into percents (and back) using number lines and visual models. The goal is to see that different notations can describe the same amount.
Students convert fractions and mixed numbers into percents, and back again, using number lines and visual models. Denominators stay at 12 or under, or divide evenly into 100.
Students practice switching between decimals, percents, fractions, and mixed numbers, showing they all name the same amount. They use number lines and diagrams to check their work.
Students compare and order up to four numbers written as fractions, decimals, or percents by using a number line, benchmark values, or equivalent forms. They explain which number is greatest or least and show their reasoning.
Students learn what negative numbers mean and practice placing them on a number line to show which values are greater or smaller.
Students place positive and negative whole numbers on a number line and name the number a given point represents. This includes situations like temperature or money to show what integers look like in real life.
Students place positive and negative whole numbers on a number line to show which is greater or lesser. A number farther left is always smaller, so students use that position to compare and sort a list of integers in order.
Students compare positive and negative whole numbers using the symbols <, >, and =. A number farther to the right on a number line is always greater.
Absolute value is how far a number sits from zero on a number line, regardless of direction. Students find that both -4 and 4 have an absolute value of 4 because each is exactly 4 steps from zero.
Students learn to spot and write repeated multiplication using exponents, such as 4³ meaning 4 × 4 × 4. They also identify perfect squares, the numbers you get when multiplying a whole number by itself, like 9 from 3 × 3.
Students learn that repeated multiplication can be written as a base number with a small raised exponent. For example, 4 x 4 x 4 becomes 4 with a 3, and they practice reading, writing, and spotting that pattern in numbers.
Students learn that perfect squares (1, 4, 9, 16...) follow a pattern and can be shown as actual square shapes. They practice building and drawing those squares up through 20 x 20.
Students figure out whether a whole number (up to 400) is a perfect square by showing it can be arranged into an equal-sided grid or by working through the math. For example, 36 is a perfect square because 6 rows of 6 equals 36.
Students learn that 10, 100, 1,000, and beyond are just 10 multiplied by itself a set number of times. They write those values using a small raised number, like 10³, by studying how each place on a number gets ten times bigger.
| Standard | Definition | Code |
|---|---|---|
| The student will reason and use multiple strategies to express equivalency… | Students compare and order fractions, mixed numbers, decimals, and percents by converting between forms to see which is larger or smaller. They use more than one method to show that different-looking numbers can be equal. | 6.NS.1 |
| Estimate and determine the percent represented by a given model | Students look at a model like a shaded grid or a number line and figure out what percent it shows, including amounts smaller than 1% or larger than 100%. | 6.NS.1.a |
| Represent and determine equivalencies among decimals | Students practice converting decimals like 0.375 into percents (and back) using number lines and visual models. The goal is to see that different notations can describe the same amount. | 6.NS.1.b |
| Represent and determine equivalencies among fractions | Students convert fractions and mixed numbers into percents, and back again, using number lines and visual models. Denominators stay at 12 or under, or divide evenly into 100. | 6.NS.1.c |
| Represent and determine equivalencies among decimals, percents, fractions | Students practice switching between decimals, percents, fractions, and mixed numbers, showing they all name the same amount. They use number lines and diagrams to check their work. | 6.NS.1.d |
| Use multiple strategies | Students compare and order up to four numbers written as fractions, decimals, or percents by using a number line, benchmark values, or equivalent forms. They explain which number is greatest or least and show their reasoning. | 6.NS.1.e |
| The student will reason and use multiple strategies to represent, compare | Students learn what negative numbers mean and practice placing them on a number line to show which values are greater or smaller. | 6.NS.2 |
| Represent integers (e.g., number lines, concrete materials, pictorial models)… | Students place positive and negative whole numbers on a number line and name the number a given point represents. This includes situations like temperature or money to show what integers look like in real life. | 6.NS.2.a |
| Compare and order integers using a number line | Students place positive and negative whole numbers on a number line to show which is greater or lesser. A number farther left is always smaller, so students use that position to compare and sort a list of integers in order. | 6.NS.2.b |
| Compare integers, using mathematical symbols | Students compare positive and negative whole numbers using the symbols <, >, and =. A number farther to the right on a number line is always greater. | 6.NS.2.c |
| Identify and describe the absolute value of an integer as the distance from… | Absolute value is how far a number sits from zero on a number line, regardless of direction. Students find that both -4 and 4 have an absolute value of 4 because each is exactly 4 steps from zero. | 6.NS.2.d |
| The student will recognize and represent patterns with whole number exponents… | Students learn to spot and write repeated multiplication using exponents, such as 4³ meaning 4 × 4 × 4. They also identify perfect squares, the numbers you get when multiplying a whole number by itself, like 9 from 3 × 3. | 6.NS.3 |
| Recognize and represent patterns with bases and exponents that are whole… | Students learn that repeated multiplication can be written as a base number with a small raised exponent. For example, 4 x 4 x 4 becomes 4 with a 3, and they practice reading, writing, and spotting that pattern in numbers. | 6.NS.3.a |
| Recognize and represent patterns of perfect squares not to exceed 202 , by… | Students learn that perfect squares (1, 4, 9, 16...) follow a pattern and can be shown as actual square shapes. They practice building and drawing those squares up through 20 x 20. | 6.NS.3.b |
| Justify if a number between 0 and 400 is a perfect square through modeling or… | Students figure out whether a whole number (up to 400) is a perfect square by showing it can be arranged into an equal-sided grid or by working through the math. For example, 36 is a perfect square because 6 rows of 6 equals 36. | 6.NS.3.c |
| Recognize and represent powers of 10 with whole number exponents by examining… | Students learn that 10, 100, 1,000, and beyond are just 10 multiplied by itself a set number of times. They write those values using a small raised number, like 10³, by studying how each place on a number gets ten times bigger. | 6.NS.3.d |
Students add, subtract, multiply, and divide fractions and mixed numbers, including word problems pulled from real situations. They also check whether their answers make sense before calling them final.
Students multiply and divide fractions and mixed numbers, showing their work through pictures, diagrams, and written calculations, not just a final answer.
Students multiply and divide fractions and mixed numbers, then simplify the answer. Denominators stay at 12 or smaller.
Multiplying a number by a fraction less than one makes it smaller. Students explore why this happens and explain what changes when you divide a number by a fraction smaller than one.
Students add and subtract fractions and mixed numbers to solve word problems, including fractions with different denominators up to 12. Answers must be simplified to their lowest form.
Students multiply and divide fractions and mixed numbers to solve word problems, then check that the answer is fully reduced. Denominators go up to 12, and problems may take more than one step.
Students add, subtract, multiply, and divide positive and negative whole numbers, including temperatures, debts, and other real-world situations. They also check whether their answer makes sense before calling it done.
Students use number lines, counters, or drawings to show what happens when they add, subtract, multiply, and divide positive and negative whole numbers.
Students practice adding, subtracting, multiplying, and dividing with negative and positive whole numbers, such as figuring out a bank balance after a withdrawal or a temperature drop below zero.
Students find the value inside absolute value bars, such as the distance between two negative numbers, then use that result in a calculation. They place the final answer on a number line.
Students solve one- and two-step word problems using positive and negative whole numbers, adding, subtracting, multiplying, or dividing to find the answer and explaining why their solution makes sense.
| Standard | Definition | Code |
|---|---|---|
| The student will estimate, demonstrate, solve | Students add, subtract, multiply, and divide fractions and mixed numbers, including word problems pulled from real situations. They also check whether their answers make sense before calling them final. | 6.CE.1 |
| Demonstrate/model multiplication and division of fractions | Students multiply and divide fractions and mixed numbers, showing their work through pictures, diagrams, and written calculations, not just a final answer. | 6.CE.1.a |
| Multiply and divide fractions | Students multiply and divide fractions and mixed numbers, then simplify the answer. Denominators stay at 12 or smaller. | 6.CE.1.b |
| Investigate and explain the effect of multiplying or dividing a fraction, whole… | Multiplying a number by a fraction less than one makes it smaller. Students explore why this happens and explain what changes when you divide a number by a fraction smaller than one. | 6.CE.1.c |
| Estimate, determine, and justify the solution to single-step and multistep… | Students add and subtract fractions and mixed numbers to solve word problems, including fractions with different denominators up to 12. Answers must be simplified to their lowest form. | 6.CE.1.d |
| Estimate, determine, and justify the solution to single-step and multistep… | Students multiply and divide fractions and mixed numbers to solve word problems, then check that the answer is fully reduced. Denominators go up to 12, and problems may take more than one step. | 6.CE.1.e |
| The student will estimate, demonstrate, solve | Students add, subtract, multiply, and divide positive and negative whole numbers, including temperatures, debts, and other real-world situations. They also check whether their answer makes sense before calling it done. | 6.CE.2 |
| Demonstrate/model addition, subtraction, multiplication | Students use number lines, counters, or drawings to show what happens when they add, subtract, multiply, and divide positive and negative whole numbers. | 6.CE.2.a |
| Add, subtract, multiply | Students practice adding, subtracting, multiplying, and dividing with negative and positive whole numbers, such as figuring out a bank balance after a withdrawal or a temperature drop below zero. | 6.CE.2.b |
| Simplify an expression that contains absolute value bars | | and an operation… | Students find the value inside absolute value bars, such as the distance between two negative numbers, then use that result in a calculation. They place the final answer on a number line. | 6.CE.2.c |
| Estimate, determine, and justify the solution to one and two-step contextual… | Students solve one- and two-step word problems using positive and negative whole numbers, adding, subtracting, multiplying, or dividing to find the answer and explaining why their solution makes sense. | 6.CE.2.d |
Students learn the parts of a circle (radius, diameter, and center), then use formulas to find how far around the edge a circle measures and how much space it covers inside.
Students learn the key parts of a circle: the radius (center to edge), diameter (all the way across), and chord (any line connecting two points on the edge). They also find the distance around the circle and the space inside it.
Circumference and diameter have a fixed relationship: divide any circle's circumference by its diameter and you get the same number every time. That number is pi, roughly 3.14.
Students measure across a circle through its center, then measure from the center to the edge. They discover the full-width measurement is always twice the shorter one.
Students measure across a circle and around its edge to discover that the distance around is always a little more than three times the distance through the center.
Students measure across the center of a circle, then unroll its edge to see that the distance around is always a little more than three times the width. That "about 3 times" relationship is pi.
Students measure the distance around several circular objects and divide each by the width across the center. Doing this repeatedly shows why pi always lands near 3.14.
Students figure out where the circumference formula comes from by measuring how the distance across a circle (the diameter) relates to the distance around it. That relationship, called pi, stays the same for every circle.
Given a circle's diameter or radius, students calculate how far it is around the edge and how much space it covers inside. Problems often come from real situations, like finding the area of a circular garden.
Students find the area and perimeter of triangles and parallelograms, working through real problems that require choosing the right formula and explaining the reasoning behind it.
Students figure out the area formulas for parallelograms and triangles by working with diagrams and grid paper, rather than just memorizing them.
Students find the distance around and the space inside triangles and parallelograms, including word problems set in real situations.
Students learn how a grid with two number lines works, then plot points on it using a pair of numbers that name an exact location. Think of it as giving an address to any spot on the grid.
Students learn the layout of a coordinate plane: where the two number lines cross (the origin), what each line is called (x-axis and y-axis), and how the plane is divided into four sections called quadrants.
Given a point written as two integers like (3, -5), students name which of the four sections of the grid it falls in, or identify when it lands exactly on one of the two number lines.
Students plot points anywhere on a coordinate grid using two whole-number coordinates, including negative numbers. They work in all four sections of the grid, not just the positive corner.
Students read points on a coordinate grid and write them as ordered pairs like (3, -2). This covers all four sections of the grid, including points that land exactly on the horizontal or vertical line.
Given a point on a grid, students explain what its two coordinates mean: one number tells how far the point sits from the vertical axis, the other tells how far it sits from the horizontal axis. Students also find the distance between two points that share a row or column.
Students plot the corners of a shape on a grid using two numbers, then find the length of its sides by comparing those numbers. Problems use whole numbers and may involve real situations like mapping a floor plan or a playing field.
Students decide whether two shapes, angles, or line segments are exactly the same size and shape. They compare figures directly, using measurements, to confirm a match or rule one out.
Students identify shapes where every side is the same length and every angle is the same size, like a stop sign or a square. Irregular polygons, like most floor tiles, do not qualify.
Students draw a line through a regular polygon (like a square or hexagon) that splits it into two mirror-image halves. Both sides must match exactly in size and shape.
Students decide whether two shapes, line segments, or angles are exactly the same size by comparing their measurements and properties.
Students compare the side lengths and angles of two polygons to decide whether the shapes are identical in size and shape, or different.
| Standard | Definition | Code |
|---|---|---|
| The student will identify the characteristics of circles and solve problems… | Students learn the parts of a circle (radius, diameter, and center), then use formulas to find how far around the edge a circle measures and how much space it covers inside. | 6.MG.1 |
| Identify and describe chord, diameter, radius, circumference | Students learn the key parts of a circle: the radius (center to edge), diameter (all the way across), and chord (any line connecting two points on the edge). They also find the distance around the circle and the space inside it. | 6.MG.1.a |
| Investigate and describe the relationship between | Circumference and diameter have a fixed relationship: divide any circle's circumference by its diameter and you get the same number every time. That number is pi, roughly 3.14. | 6.MG.1.b |
| Investigate and describe the relationship between diameter and radius | Students measure across a circle through its center, then measure from the center to the edge. They discover the full-width measurement is always twice the shorter one. | 6.MG.1.b.i |
| Investigate and describe the relationship between radius and circumference | Students measure across a circle and around its edge to discover that the distance around is always a little more than three times the distance through the center. | 6.MG.1.b.ii |
| Investigate and describe the relationship between diameter and circumference | Students measure across the center of a circle, then unroll its edge to see that the distance around is always a little more than three times the width. That "about 3 times" relationship is pi. | 6.MG.1.b.iii |
| Develop an approximation for pi | Students measure the distance around several circular objects and divide each by the width across the center. Doing this repeatedly shows why pi always lands near 3.14. | 6.MG.1.c |
| Develop the formula for circumference using the relationship between diameter… | Students figure out where the circumference formula comes from by measuring how the distance across a circle (the diameter) relates to the distance around it. That relationship, called pi, stays the same for every circle. | 6.MG.1.d |
| Solve problems, including those in context, involving circumference and area of… | Given a circle's diameter or radius, students calculate how far it is around the edge and how much space it covers inside. Problems often come from real situations, like finding the area of a circular garden. | 6.MG.1.e |
| The student will reason mathematically to solve problems, including those in… | Students find the area and perimeter of triangles and parallelograms, working through real problems that require choosing the right formula and explaining the reasoning behind it. | 6.MG.2 |
| Develop the formula for determining the area of parallelograms and triangles… | Students figure out the area formulas for parallelograms and triangles by working with diagrams and grid paper, rather than just memorizing them. | 6.MG.2.a |
| Solve problems, including those in context, involving the perimeter and area of… | Students find the distance around and the space inside triangles and parallelograms, including word problems set in real situations. | 6.MG.2.b |
| The student will describe the characteristics of the coordinate plane and graph… | Students learn how a grid with two number lines works, then plot points on it using a pair of numbers that name an exact location. Think of it as giving an address to any spot on the grid. | 6.MG.3 |
| Identify and label the axes, origin | Students learn the layout of a coordinate plane: where the two number lines cross (the origin), what each line is called (x-axis and y-axis), and how the plane is divided into four sections called quadrants. | 6.MG.3.a |
| Identify and describe the location | Given a point written as two integers like (3, -5), students name which of the four sections of the grid it falls in, or identify when it lands exactly on one of the two number lines. | 6.MG.3.b |
| Graph ordered pairs in the four quadrants and on the axes of a coordinate plane | Students plot points anywhere on a coordinate grid using two whole-number coordinates, including negative numbers. They work in all four sections of the grid, not just the positive corner. | 6.MG.3.c |
| Identify ordered pairs represented by points in the four quadrants and on the… | Students read points on a coordinate grid and write them as ordered pairs like (3, -2). This covers all four sections of the grid, including points that land exactly on the horizontal or vertical line. | 6.MG.3.d |
| Relate the coordinates of a point to the distance from each axis and relate the… | Given a point on a grid, students explain what its two coordinates mean: one number tells how far the point sits from the vertical axis, the other tells how far it sits from the horizontal axis. Students also find the distance between two points that share a row or column. | 6.MG.3.e |
| Draw polygons in the coordinate plane given coordinates for the vertices | Students plot the corners of a shape on a grid using two numbers, then find the length of its sides by comparing those numbers. Problems use whole numbers and may involve real situations like mapping a floor plan or a playing field. | 6.MG.3.f |
| The student will determine congruence of segments, angles | Students decide whether two shapes, angles, or line segments are exactly the same size and shape. They compare figures directly, using measurements, to confirm a match or rule one out. | 6.MG.4 |
| Identify regular polygons | Students identify shapes where every side is the same length and every angle is the same size, like a stop sign or a square. Irregular polygons, like most floor tiles, do not qualify. | 6.MG.4.a |
| Draw lines of symmetry to divide regular polygons into two congruent parts | Students draw a line through a regular polygon (like a square or hexagon) that splits it into two mirror-image halves. Both sides must match exactly in size and shape. | 6.MG.4.b |
| Determine the congruence of segments, angles | Students decide whether two shapes, line segments, or angles are exactly the same size by comparing their measurements and properties. | 6.MG.4.c |
| Determine whether polygons are congruent or noncongruent according to the… | Students compare the side lengths and angles of two polygons to decide whether the shapes are identical in size and shape, or different. | 6.MG.4.d |
Students collect real information, organize it into categories, and display it as a circle graph that shows how each part compares to the whole. Then they explain what the graph reveals.
Students come up with a question that can be answered by collecting data and showing it as a circle graph, such as "What is the most common way students in our class get to school?"
Students figure out what information they need to answer a question, then gather it by observing, measuring, surveying, or running an experiment.
Students learn what makes a sample fair, specifically why the group surveyed needs to reflect the full population, not just the easiest or nearest people to ask.
Students take a set of data and display it as a pie chart, dividing the circle into slices that show how each part compares to the whole. The numbers stay simple enough to work out by hand.
Students read a circle graph and explain what the data shows, comparing sections to draw a conclusion about the whole.
Students look at the same set of data displayed as a circle graph and as a bar graph or dot plot, then decide which version makes the data easier to read and explain why.
Students learn that the mean (average) is a balancing point in a data set. They also practice predicting how the mean, median, or range shifts when a single number is added, removed, or swapped out.
Students find the mean of a data set, then mark it on a dot plot as the point where the data balances equally on both sides, like the center of a seesaw.
Adding, removing, or changing one number in a data set can shift the mean, median, or mode. Students practice predicting how that shift plays out when a single value changes.
Students look at a set of numbers to spot any value that stands far apart from the rest, then figure out how removing or including that unusual value changes the average, middle, or spread of the data.
| Standard | Definition | Code |
|---|---|---|
| The student will apply the data cycle | Students collect real information, organize it into categories, and display it as a circle graph that shows how each part compares to the whole. Then they explain what the graph reveals. | 6.PS.1 |
| Formulate questions that require the collection or acquisition of data with a… | Students come up with a question that can be answered by collecting data and showing it as a circle graph, such as "What is the most common way students in our class get to school?" | 6.PS.1.a |
| Determine the data needed to answer a formulated question and collect the data | Students figure out what information they need to answer a question, then gather it by observing, measuring, surveying, or running an experiment. | 6.PS.1.b |
| Determine the factors that will ensure that the data collected is a sample that… | Students learn what makes a sample fair, specifically why the group surveyed needs to reflect the full population, not just the easiest or nearest people to ask. | 6.PS.1.c |
| Organize and represent data using circle graphs, with and without the use of… | Students take a set of data and display it as a pie chart, dividing the circle into slices that show how each part compares to the whole. The numbers stay simple enough to work out by hand. | 6.PS.1.d |
| Analyze data represented in a circle graph by making observations and drawing… | Students read a circle graph and explain what the data shows, comparing sections to draw a conclusion about the whole. | 6.PS.1.e |
| Compare data represented in a circle graph with the same data represented in… | Students look at the same set of data displayed as a circle graph and as a bar graph or dot plot, then decide which version makes the data easier to read and explain why. | 6.PS.1.f |
| The student will represent the mean as a balance point and determine the effect… | Students learn that the mean (average) is a balancing point in a data set. They also practice predicting how the mean, median, or range shifts when a single number is added, removed, or swapped out. | 6.PS.2 |
| Represent the mean of a set of data graphically as the balance point… | Students find the mean of a data set, then mark it on a dot plot as the point where the data balances equally on both sides, like the center of a seesaw. | 6.PS.2.a |
| Determine the effect on measures of center when a single value of a data set is… | Adding, removing, or changing one number in a data set can shift the mean, median, or mode. Students practice predicting how that shift plays out when a single value changes. | 6.PS.2.b |
| Observe patterns in data to identify outliers and determine their effect on… | Students look at a set of numbers to spot any value that stands far apart from the rest, then figure out how removing or including that unusual value changes the average, middle, or spread of the data. | 6.PS.2.c |
Ratios compare two quantities, like 3 red tiles to 5 blue tiles. Students write and interpret those comparisons to describe real situations, such as mixing ingredients or reading a map scale.
A ratio compares two quantities, like 3 red tiles for every 5 blue tiles. Students write and interpret these comparisons using fraction notation, colon notation, or words.
Students write the same ratio three different ways: as a fraction, with a colon, and in words. For example, 3 out of 5 students preferred pizza could be written as 3/5, 3:5, or 3 to 5.
Students practice writing ratios that compare parts of a group to each other, a part to the whole group, or two separate totals. For example, comparing boys to girls in a class, or red marbles to all the marbles in a bag.
Students take a ratio written in numbers or symbols, like 3:2, and put it into plain words that describe what those numbers actually mean in a real situation.
Students build a table of number pairs that all share the same ratio, like doubling both sides of a recipe to show the same relationship holds at every scale.
Students build a table that shows how two quantities grow together at the same rate, like miles per hour or cups per serving, using a real-world situation as the starting point.
Students learn to spot when two quantities grow together at a steady rate, like price per item or miles per hour. They write and graph those relationships using tables, equations, and graphs.
Given a table, graph, or real-world situation, students find the unit rate, which is how much of one thing happens per single unit of another, like cost per item or miles per hour.
Students use a unit rate to fill in a missing number in a ratio table. For example, if 2 items cost $6, they find the cost per item and use that to figure out what 5 items would cost.
Looking at a table, a graph, or a word problem, students decide whether two quantities change at a constant rate together, such as whether doubling one always doubles the other.
Given a real-world situation with a proportional relationship, students find the unit rate and show the relationship in a table or graph.
Students take the same proportional relationship and show it three different ways: in words, in a ratio table, and on a graph. The goal is to see how all three versions tell the same story.
Students write and solve simple equations with one unknown, like finding a missing number when told "some number plus 7 equals 15." They practice with both plain number puzzles and real situations that call for the same skill.
Students learn the building blocks of algebra: what makes something an equation versus an expression, what a variable stands for, and what a coefficient does to the number next to it.
Students set up and solve a simple equation with one unknown, using tools like balance scales or tiles to figure out what value makes both sides equal.
Students solve a simple equation with one unknown, like 3x = 12 or x/4 = 5, using properties of equality to find the missing value. Whole numbers and basic fractions are the only numbers involved.
Students check whether their answer to a simple equation is correct by plugging it back in or using physical tools like balance scales or algebra tiles to see if both sides stay equal.
Students read a word problem and turn it into a simple equation, like writing x + 5 = 12 to represent a situation where a number plus five equals twelve.
Students start with an equation like x + 5 = 12 and write a real-life word problem that fits it. They work backward from the math to the story.
Students write an inequality (like x > 5) to describe a real-world situation, then plot the solution on a number line to show all the values that make it true.
Given a number line with a shaded region and an open or closed dot, students write the matching inequality two different ways using symbols like < or ≥.
Students read a real-world condition, such as a speed limit or a minimum age, and write an inequality like x > 16 to capture it. They also work the other direction, reading a number line graph and writing the inequality it shows.
Given a simple inequality like x > 5, students write a real-world situation that matches it or plot the solution on a number line, using an open or closed circle to show whether the boundary number counts.
Students check whether a number makes an inequality true by plugging it in or by finding where it lands on a number line. They explain why it works or why it doesn't.
Given an inequality like x > 3, students pick numbers that make it true and explain why those numbers work as solutions.
| Standard | Definition | Code |
|---|---|---|
| The student will use ratios to represent relationships between quantities… | Ratios compare two quantities, like 3 red tiles to 5 blue tiles. Students write and interpret those comparisons to describe real situations, such as mixing ingredients or reading a map scale. | 6.PFA.1 |
| Represent a relationship between two quantities using ratios | A ratio compares two quantities, like 3 red tiles for every 5 blue tiles. Students write and interpret these comparisons using fraction notation, colon notation, or words. | 6.PFA.1.a |
| Represent a relationship in context that makes a comparison by using the… | Students write the same ratio three different ways: as a fraction, with a colon, and in words. For example, 3 out of 5 students preferred pizza could be written as 3/5, 3:5, or 3 to 5. | 6.PFA.1.b |
| Represent different comparisons within the same quantity or between different… | Students practice writing ratios that compare parts of a group to each other, a part to the whole group, or two separate totals. For example, comparing boys to girls in a class, or red marbles to all the marbles in a bag. | 6.PFA.1.c |
| Create a relationship in words for a given ratio expressed symbolically | Students take a ratio written in numbers or symbols, like 3:2, and put it into plain words that describe what those numbers actually mean in a real situation. | 6.PFA.1.d |
| Create a table of equivalent ratios to represent a proportional relationship… | Students build a table of number pairs that all share the same ratio, like doubling both sides of a recipe to show the same relationship holds at every scale. | 6.PFA.1.e |
| Create a table of equivalent ratios to represent a proportional relationship… | Students build a table that shows how two quantities grow together at the same rate, like miles per hour or cups per serving, using a real-world situation as the starting point. | 6.PFA.1.f |
| The student will identify and represent proportional relationships between… | Students learn to spot when two quantities grow together at a steady rate, like price per item or miles per hour. They write and graph those relationships using tables, equations, and graphs. | 6.PFA.2 |
| Identify the unit rate of a proportional relationship represented by a table of… | Given a table, graph, or real-world situation, students find the unit rate, which is how much of one thing happens per single unit of another, like cost per item or miles per hour. | 6.PFA.2.a |
| Determine a missing value in a ratio table that represents a proportional… | Students use a unit rate to fill in a missing number in a ratio table. For example, if 2 items cost $6, they find the cost per item and use that to figure out what 5 items would cost. | 6.PFA.2.b |
| Determine whether a proportional relationship exists between two quantities… | Looking at a table, a graph, or a word problem, students decide whether two quantities change at a constant rate together, such as whether doubling one always doubles the other. | 6.PFA.2.c |
| When given a contextual situation representing a proportional relationship… | Given a real-world situation with a proportional relationship, students find the unit rate and show the relationship in a table or graph. | 6.PFA.2.d |
| Make connections between and among multiple representations of the same… | Students take the same proportional relationship and show it three different ways: in words, in a ratio table, and on a graph. The goal is to see how all three versions tell the same story. | 6.PFA.2.e |
| The student will write and solve one-step linear equations in one variable… | Students write and solve simple equations with one unknown, like finding a missing number when told "some number plus 7 equals 15." They practice with both plain number puzzles and real situations that call for the same skill. | 6.PFA.3 |
| Identify and develop examples of the following algebraic vocabulary | Students learn the building blocks of algebra: what makes something an equation versus an expression, what a variable stands for, and what a coefficient does to the number next to it. | 6.PFA.3.a |
| Represent and solve one-step linear equations in one variable, using a variety… | Students set up and solve a simple equation with one unknown, using tools like balance scales or tiles to figure out what value makes both sides equal. | 6.PFA.3.b |
| Apply properties of real numbers and properties of equality to solve a one-step… | Students solve a simple equation with one unknown, like 3x = 12 or x/4 = 5, using properties of equality to find the missing value. Whole numbers and basic fractions are the only numbers involved. | 6.PFA.3.c |
| Confirm solutions to one-step linear equations in one variable using a variety… | Students check whether their answer to a simple equation is correct by plugging it back in or using physical tools like balance scales or algebra tiles to see if both sides stay equal. | 6.PFA.3.d |
| Write a one-step linear equation in one variable to represent a verbal… | Students read a word problem and turn it into a simple equation, like writing x + 5 = 12 to represent a situation where a number plus five equals twelve. | 6.PFA.3.e |
| Create a verbal situation in context given a one-step linear equation in one… | Students start with an equation like x + 5 = 12 and write a real-life word problem that fits it. They work backward from the math to the story. | 6.PFA.3.f |
| The student will represent a contextual situation using a linear inequality in… | Students write an inequality (like x > 5) to describe a real-world situation, then plot the solution on a number line to show all the values that make it true. | 6.PFA.4 |
| Given the graph of a linear inequality in one variable on a number line… | Given a number line with a shaded region and an open or closed dot, students write the matching inequality two different ways using symbols like < or ≥. | 6.PFA.4.a |
| Write a linear inequality in one variable to represent a given constraint or… | Students read a real-world condition, such as a speed limit or a minimum age, and write an inequality like x > 16 to capture it. They also work the other direction, reading a number line graph and writing the inequality it shows. | 6.PFA.4.b |
| Given a linear inequality in one variable, create a corresponding contextual… | Given a simple inequality like x > 5, students write a real-world situation that matches it or plot the solution on a number line, using an open or closed circle to show whether the boundary number counts. | 6.PFA.4.c |
| Use substitution or a number line graph to justify whether a given number in a… | Students check whether a number makes an inequality true by plugging it in or by finding where it lands on a number line. They explain why it works or why it doesn't. | 6.PFA.4.d |
| Identify a numerical value | Given an inequality like x > 3, students pick numbers that make it true and explain why those numbers work as solutions. | 6.PFA.4.e |
Standards of Learning mathematics assessment for grades 3 through 8.
Shorter computer-adaptive mathematics growth assessments for grades 3 through 8, administered during the school year in addition to spring SOL tests.
Alternate assessment program for eligible students with significant cognitive disabilities, covering state-tested grades and subjects.
Students work with fractions, decimals, and percents as different names for the same amount. They start using negative numbers, ratios, and simple equations with a letter standing in for an unknown. They also find the area of triangles and the distance around a circle.
Look for them together in real life. A sale tag that says 25 percent off, a recipe that calls for three-quarters of a cup, and a phone battery at 0.40 are all the same kind of thinking. Ask which is bigger and how they know.
Students learn that numbers go both ways from zero, like a thermometer or money owed. They add, subtract, multiply, and divide with them, and place them on a number line. Talking about cold temperatures or a bank balance helps make it feel normal.
A ratio compares two amounts, like 3 cups of flour to 2 cups of sugar. A unit rate is the cost or amount for just one, like dollars per pound or miles per hour. Grocery shopping and cooking give easy practice.
Most teachers start with fractions, decimals, and percents as equivalent forms, then move into integers and absolute value. Ratios and proportional reasoning come next, followed by one-step equations and inequalities. Circles, triangles, the coordinate plane, and circle graphs fit well in the second half.
Dividing fractions and mixed numbers, signed-number operations, and the meaning of a unit rate tend to need extra time. Students also confuse area and circumference, and they often skip checking whether a one-step equation actually balances. Plan short cycles of practice across the year, not one big unit.
Students can move between fractions, decimals, and percents without a calculator for common values. They solve one-step equations and basic ratio problems in context, find the area of a triangle or parallelogram, and use the circle formulas when given the radius or diameter.
Watch for fluent work with signed numbers, confident use of ratios and unit rates, and clean setup of one-step equations from a word problem. Students should also graph points in all four quadrants and read a circle graph without prompting. Those are the habits next year leans on right away.
Ask them to read it twice and say what the question is asking in their own words. Then have them write down what they know and draw a quick picture or number line. The picture often makes the next step show up on its own.