Place value to ten thousand
Students read, write, and compare bigger numbers up to 100,000. They explain how a digit's spot in a number changes its value, and find 100 or 1,000 more and less in their head.
This is the year math stretches into the thousands and steps into multiplication. Students learn to read big numbers by their place value, add and subtract within a thousand using mental strategies, and start multiplying and dividing with small numbers up to 144. They also split shapes and number lines into halves, thirds, fourths, and eighths to make sense of fractions. By spring, students can solve a multiplication story problem, measure a length to the nearest quarter inch, and show that one-half equals two-fourths.
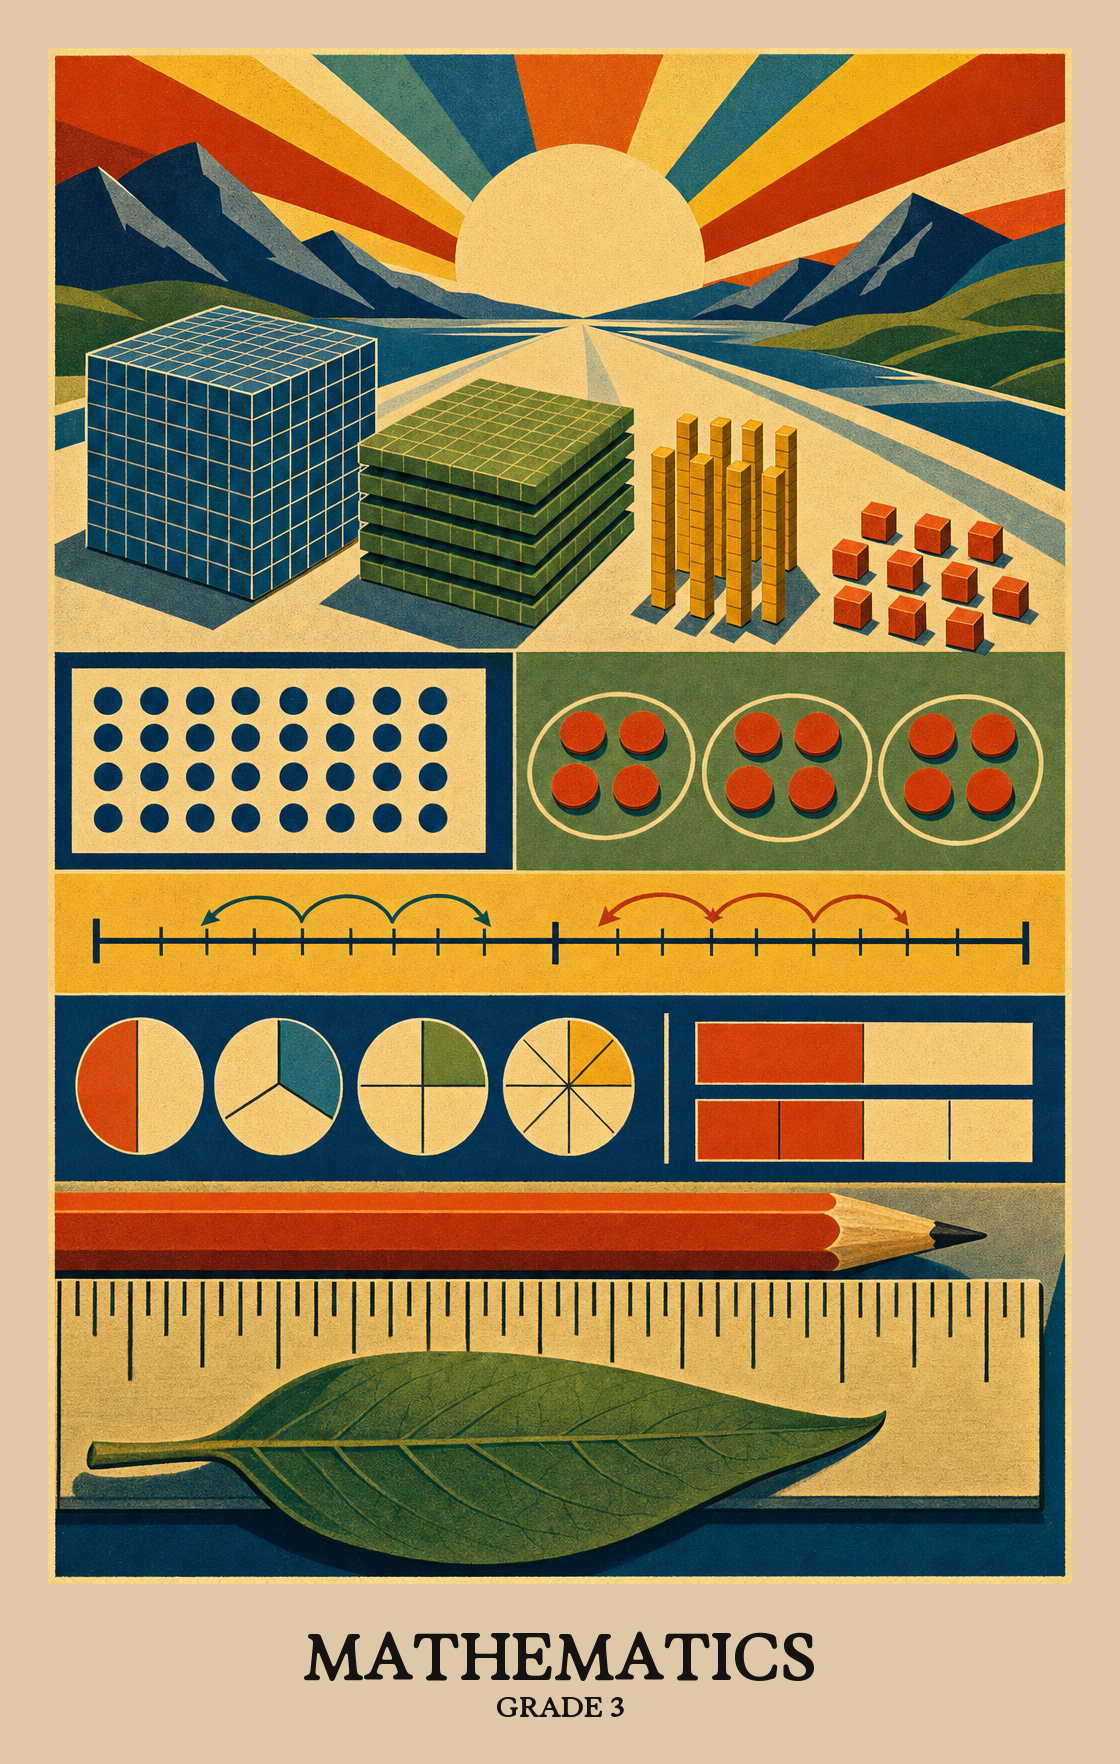
Students read, write, and compare bigger numbers up to 100,000. They explain how a digit's spot in a number changes its value, and find 100 or 1,000 more and less in their head.
Students add and subtract three-digit numbers using a mix of strategies, not just one stacked method. They also estimate first to check if an answer makes sense, and use this when working with money.
Students learn that multiplication is equal groups and division is sharing or grouping those amounts back out. They build fluency with 2s, 5s, 10s, and square facts, and solve word problems with pictures.
Students cut circles, rectangles, and number lines into halves, thirds, fourths, and eighths. They see that one half can also be written as two fourths or four eighths, and compare which unit fractions are larger.
Students measure to the nearest fourth of an inch, find the distance around a shape, and draw polygons with a given number of sides. They also count change up to a dollar using cent and dollar signs.
Students ask questions that data can answer, then collect and show results in bar graphs, picture graphs, and line plots. They also describe number patterns and decide if events are likely, unlikely, or certain.
Students look at a chart or set of numbers, spot patterns in what they see, and come up with questions that data can actually answer.
Students learn that data can come from different places: asking people questions, sorting objects into groups, or measuring things like height or temperature. They practice choosing the right method to answer a real question.
Students gather information to answer a question, then organize and display it as a chart, graph, or table. They also figure out what to do when some data is missing.
Students make predictions from data they've collected, then see how those predictions change when they gather more data or get it from a different source. More data usually means a better guess.
Students look at charts and graphs with different scales, then use what they see to back up a claim or solve a problem.
Students sort outcomes by how likely they are to happen. Flipping heads might be "equally likely" with tails, while rolling a 7 on a standard die is impossible.
| Standard | Definition | Code |
|---|---|---|
| Notice and describe patterns in data-rich situations or given data sets | Students look at a chart or set of numbers, spot patterns in what they see, and come up with questions that data can actually answer. | 3.1.1.1 |
| Describe how data can be collected, including from surveys, grouping of items… | Students learn that data can come from different places: asking people questions, sorting objects into groups, or measuring things like height or temperature. They practice choosing the right method to answer a real question. | 3.1.1.2 |
| Collect and organize data to answer a statistical question using various tools… | Students gather information to answer a question, then organize and display it as a chart, graph, or table. They also figure out what to do when some data is missing. | 3.1.1.3 |
| Make predictions and recognize that the amount and source of the data impacts… | Students make predictions from data they've collected, then see how those predictions change when they gather more data or get it from a different source. More data usually means a better guess. | 3.1.1.4 |
| Critically analyze data visualizations, including frequency tables, bar graphs… | Students look at charts and graphs with different scales, then use what they see to back up a claim or solve a problem. | 3.1.1.5 |
| Describe outcomes of events as impossible, certain, likely, unlikely and… | Students sort outcomes by how likely they are to happen. Flipping heads might be "equally likely" with tails, while rolling a 7 on a standard die is impossible. | 3.1.2.1 |
Students measure objects using a ruler, marking how long something is to the nearest quarter inch. They practice reading the small marks between whole numbers to get a more precise measurement.
Students learn that some units are better for measuring big things and others for small things. They compare pairs like inches and feet, or grams and kilograms, and explain why one unit fits the job better than the other.
Students add up the lengths of all the sides of a shape to find its total distance around the outside. They work with whole numbers only.
Students figure out how much change to give or receive when buying something, and practice writing those amounts using $ and ¢ signs correctly.
Students draw and build polygons by counting sides: a triangle has 3, a square or rectangle has 4, a pentagon has 5, a hexagon has 6, and an octagon has 8. The shapes can look neat and even or lopsided and irregular.
| Standard | Definition | Code |
|---|---|---|
| Measure lengths to the nearest fourth when measuring with standard units | Students measure objects using a ruler, marking how long something is to the nearest quarter inch. They practice reading the small marks between whole numbers to get a more precise measurement. | 3.2.3.1 |
| Compare and contrast the relative sizes of measurement units within one system | Students learn that some units are better for measuring big things and others for small things. They compare pairs like inches and feet, or grams and kilograms, and explain why one unit fits the job better than the other. | 3.2.3.2 |
| Calculate the perimeter of a polygon with whole number side lengths | Students add up the lengths of all the sides of a shape to find its total distance around the outside. They work with whole numbers only. | 3.2.3.3 |
| Use addition and subtraction with whole numbers, within 100, to calculate… | Students figure out how much change to give or receive when buying something, and practice writing those amounts using $ and ¢ signs correctly. | 3.2.3.4 |
| Create representations of regular and irregular polygons with a given number of… | Students draw and build polygons by counting sides: a triangle has 3, a square or rectangle has 4, a pentagon has 5, a hexagon has 6, and an octagon has 8. The shapes can look neat and even or lopsided and irregular. | 3.2.4.1 |
Students practice jumping forward or backward by 100, 1,000, or 10,000 from any number, without pencil or paper. They explain how they know the answer is right.
Students learn that any number between 10 and 10,000 is built from groups of thousands, hundreds, tens, and ones. For example, 1,000 is the same as 10 hundreds, and 10,000 is the same as 100 hundreds.
Students line up whole numbers into the hundred thousands from smallest to largest, explaining why one number is bigger or smaller using place value, a number line, and the greater than, less than, and equal signs.
Students practice making quick, close guesses when adding or subtracting numbers up to 1,000. They use round numbers like 500 or 700 as anchors to check whether an answer makes sense.
Students practice different ways to add and subtract numbers up to 1,000, such as breaking numbers apart by hundreds, tens, and ones. They also explain why each method works.
Students use pictures and drawings to solve multiplication and division word problems, with single-digit numbers. They show their thinking visually before writing an answer.
Students practice multiplication and division with numbers up to 144, building speed with the 2s, 5s, and 10s times tables. They learn how multiplication and division work together, using grouping and patterns to find answers.
Students figure out problems like 6 x 40 or 7 x 300 by thinking about place value and what they already know about single-digit multiplication. The focus is on building a reliable strategy, not just memorizing the answer.
Students cut shapes like circles and rectangles into equal parts, splitting them into 2, 3, 4, or 8 pieces. They do the same on a number line, dividing the space between 0 and 1 into equal sections.
Students break a fraction like 3/4 into smaller same-named pieces, such as 1/4 plus 1/4 plus 1/4, then draw or write symbols to show how those pieces add up.
Students show different ways to write one-half or a whole using fractions like 2/4 or 4/8, then use a drawing or diagram to explain why those fractions are equal.
Students compare fractions like 1/2, 1/3, and 1/4 using pictures or diagrams, then explain why a bigger bottom number actually means a smaller piece of the whole.
Students practice budgeting by adding and subtracting rounded numbers to plan short-term and long-term saving and spending goals, including surprises like unexpected expenses.
Students figure out the missing number that makes an addition or subtraction equation balance, then explain whether the equation is true or false. Numbers go up to three digits, like 347 + ? = 500.
Students figure out why multiplying by 0 always gives 0 and multiplying by 1 leaves a number unchanged, then explain how they know. They test number equations to decide if they are true or false.
Students test whether switching the order of numbers (like 4 + 3 versus 3 + 4) or regrouping them changes the answer. They explain why an equation is true or false, using what they notice about how addition and multiplication work.
Students follow a rule (like "add 5" or "multiply by 3") to fill in a table showing what goes in and what comes out. They use that pattern to solve problems and figure out what happens when the starting number is 0.
Looking at a pattern that grows or shrinks, students figure out the next two shapes or steps coming up and the one that came before, then explain how they know.
| Standard | Definition | Code |
|---|---|---|
| Given a value, mentally find 100 more or 100 less, 1,000 more or 1,000 less and… | Students practice jumping forward or backward by 100, 1,000, or 10,000 from any number, without pencil or paper. They explain how they know the answer is right. | 3.3.5.1 |
| Recognize and describe the place value of numbers between 10 and 10,000 as a… | Students learn that any number between 10 and 10,000 is built from groups of thousands, hundreds, tens, and ones. For example, 1,000 is the same as 10 hundreds, and 10,000 is the same as 100 hundreds. | 3.3.5.2 |
| Compare and order whole numbers up to 100,000 justifying with place value… | Students line up whole numbers into the hundred thousands from smallest to largest, explaining why one number is bigger or smaller using place value, a number line, and the greater than, less than, and equal signs. | 3.3.5.3 |
| Estimate sums and differences up to 1,000 using strategies based on benchmarks… | Students practice making quick, close guesses when adding or subtracting numbers up to 1,000. They use round numbers like 500 or 700 as anchors to check whether an answer makes sense. | 3.3.5.4 |
| Use a range of strategies and algorithms based on knowledge of place value and… | Students practice different ways to add and subtract numbers up to 1,000, such as breaking numbers apart by hundreds, tens, and ones. They also explain why each method works. | 3.3.5.5 |
| Represent and solve contextual situations involving multiplication, measurement… | Students use pictures and drawings to solve multiplication and division word problems, with single-digit numbers. They show their thinking visually before writing an answer. | 3.3.5.6 |
| Multiply and divide within 144, using strategies such as equal groups, repeated… | Students practice multiplication and division with numbers up to 144, building speed with the 2s, 5s, and 10s times tables. They learn how multiplication and division work together, using grouping and patterns to find answers. | 3.3.5.7 |
| Multiply one-digit whole numbers by multiples of 10 and 100 using strategies… | Students figure out problems like 6 x 40 or 7 x 300 by thinking about place value and what they already know about single-digit multiplication. The focus is on building a reliable strategy, not just memorizing the answer. | 3.3.5.8 |
| Partition a whole into halves, thirds, fourths and eighths | Students cut shapes like circles and rectangles into equal parts, splitting them into 2, 3, 4, or 8 pieces. They do the same on a number line, dividing the space between 0 and 1 into equal sections. | 3.3.5.9 |
| Use pictures and symbols to represent non- unit fractions up to 2 as sums of… | Students break a fraction like 3/4 into smaller same-named pieces, such as 1/4 plus 1/4 plus 1/4, then draw or write symbols to show how those pieces add up. | 3.3.5.10 |
| Generate equivalent forms of one-half and 1 using fractions with denominators… | Students show different ways to write one-half or a whole using fractions like 2/4 or 4/8, then use a drawing or diagram to explain why those fractions are equal. | 3.3.5.11 |
| Compare and order unit fractions using visual models and describe how the size… | Students compare fractions like 1/2, 1/3, and 1/4 using pictures or diagrams, then explain why a bigger bottom number actually means a smaller piece of the whole. | 3.3.5.12 |
| Use addition and subtraction with estimated whole numbers to create short- term… | Students practice budgeting by adding and subtracting rounded numbers to plan short-term and long-term saving and spending goals, including surprises like unexpected expenses. | 3.3.5.13 |
| Use relational thinking to find a missing value in an open number sentence with… | Students figure out the missing number that makes an addition or subtraction equation balance, then explain whether the equation is true or false. Numbers go up to three digits, like 347 + ? = 500. | 3.3.6.1 |
| Make conjectures and justifications about multiplication and division involving… | Students figure out why multiplying by 0 always gives 0 and multiplying by 1 leaves a number unchanged, then explain how they know. They test number equations to decide if they are true or false. | 3.3.6.2 |
| Make conjectures and justifications using the commutative and associative… | Students test whether switching the order of numbers (like 4 + 3 versus 3 + 4) or regrouping them changes the answer. They explain why an equation is true or false, using what they notice about how addition and multiplication work. | 3.3.6.3 |
| Create, describe and apply single-operation input-output rules involving… | Students follow a rule (like "add 5" or "multiply by 3") to fill in a table showing what goes in and what comes out. They use that pattern to solve problems and figure out what happens when the starting number is 0. | 3.3.7.1 |
| Create the next two terms and the previous term in a visual pattern, growing or… | Looking at a pattern that grows or shrinks, students figure out the next two shapes or steps coming up and the one that came before, then explain how they know. | 3.3.7.2 |
Standards-based mathematics assessment for grades 3 through 8 and grade 11, aligned to Minnesota Academic Standards.
Alternate standards-based assessment for eligible students with the most significant cognitive disabilities, administered in the same subjects and grades as the MCA program.
Students should add and subtract numbers up to 1,000, multiply and divide within 144, and know their 2s, 5s, 10s, and square facts by heart. They should also work with simple fractions like halves, fourths, and eighths, and measure to the nearest quarter inch.
Practice 2s, 5s, and 10s first, since those come quickest and unlock the rest. Five minutes in the car or before dinner is enough. Skip counting out loud, flash cards, and quick games all work. The goal is fast recall, not speed drills that cause stress.
Start with equal groups and repeated addition so students see what multiplication means. Build fluency with 2s, 5s, 10s, and square facts before pushing into the harder ones. Bring in division alongside multiplication so students see them as the same relationship from two sides.
Students split shapes and number lines into halves, thirds, fourths, and eighths. They build fractions like three-fourths from unit pieces, compare fractions with the same numerator, and show why one-half equals two-fourths or four-eighths using a picture.
Cooking and pizza nights do most of the work. Ask students to cut something into fourths or eighths, then ask which piece is bigger and why. Folding paper into halves and fourths is another quick way to see equal parts without any worksheets.
Place value with larger numbers and the meaning of fractions tend to need the most return visits. Students often memorize digits without seeing groups of hundreds and thousands, and they confuse a bigger denominator with a bigger piece. Plan to revisit both in short cycles across the year.
Students measure with a ruler to the nearest quarter inch and compare units like inches and feet or grams and kilograms. They also find the perimeter of shapes by adding side lengths and make change up to a dollar using coins and bills.
Hand over the change at the store and ask how much came back. Measure something together with a ruler or tape, like a shoe or a table, to the nearest quarter inch. Weighing fruit in the produce aisle is another quick way to talk about pounds and ounces.
By spring, students should add and subtract within 1,000 with confidence, know most multiplication facts through ten, and explain a fraction using a picture or number line. They should also read and compare numbers up to 100,000 using place value language.
Students ask a question, collect answers from classmates, and show the results in a bar graph or picture graph. They read graphs to answer questions and start talking about whether an event is likely, unlikely, certain, or impossible.