Place value and big numbers
Students read, write, and compare numbers up to six digits. They learn what each digit is worth and put numbers in order from smallest to largest.
This is the year math stretches into bigger numbers and faster thinking. Students read and write numbers up to six digits, add and subtract within 1,000, and learn their times tables through 10 by 10 well enough to answer without counting. They also start working with fractions, measuring with rulers and clocks, and reading bar graphs. By spring, students can recall multiplication facts quickly and solve a word problem that needs more than one step.
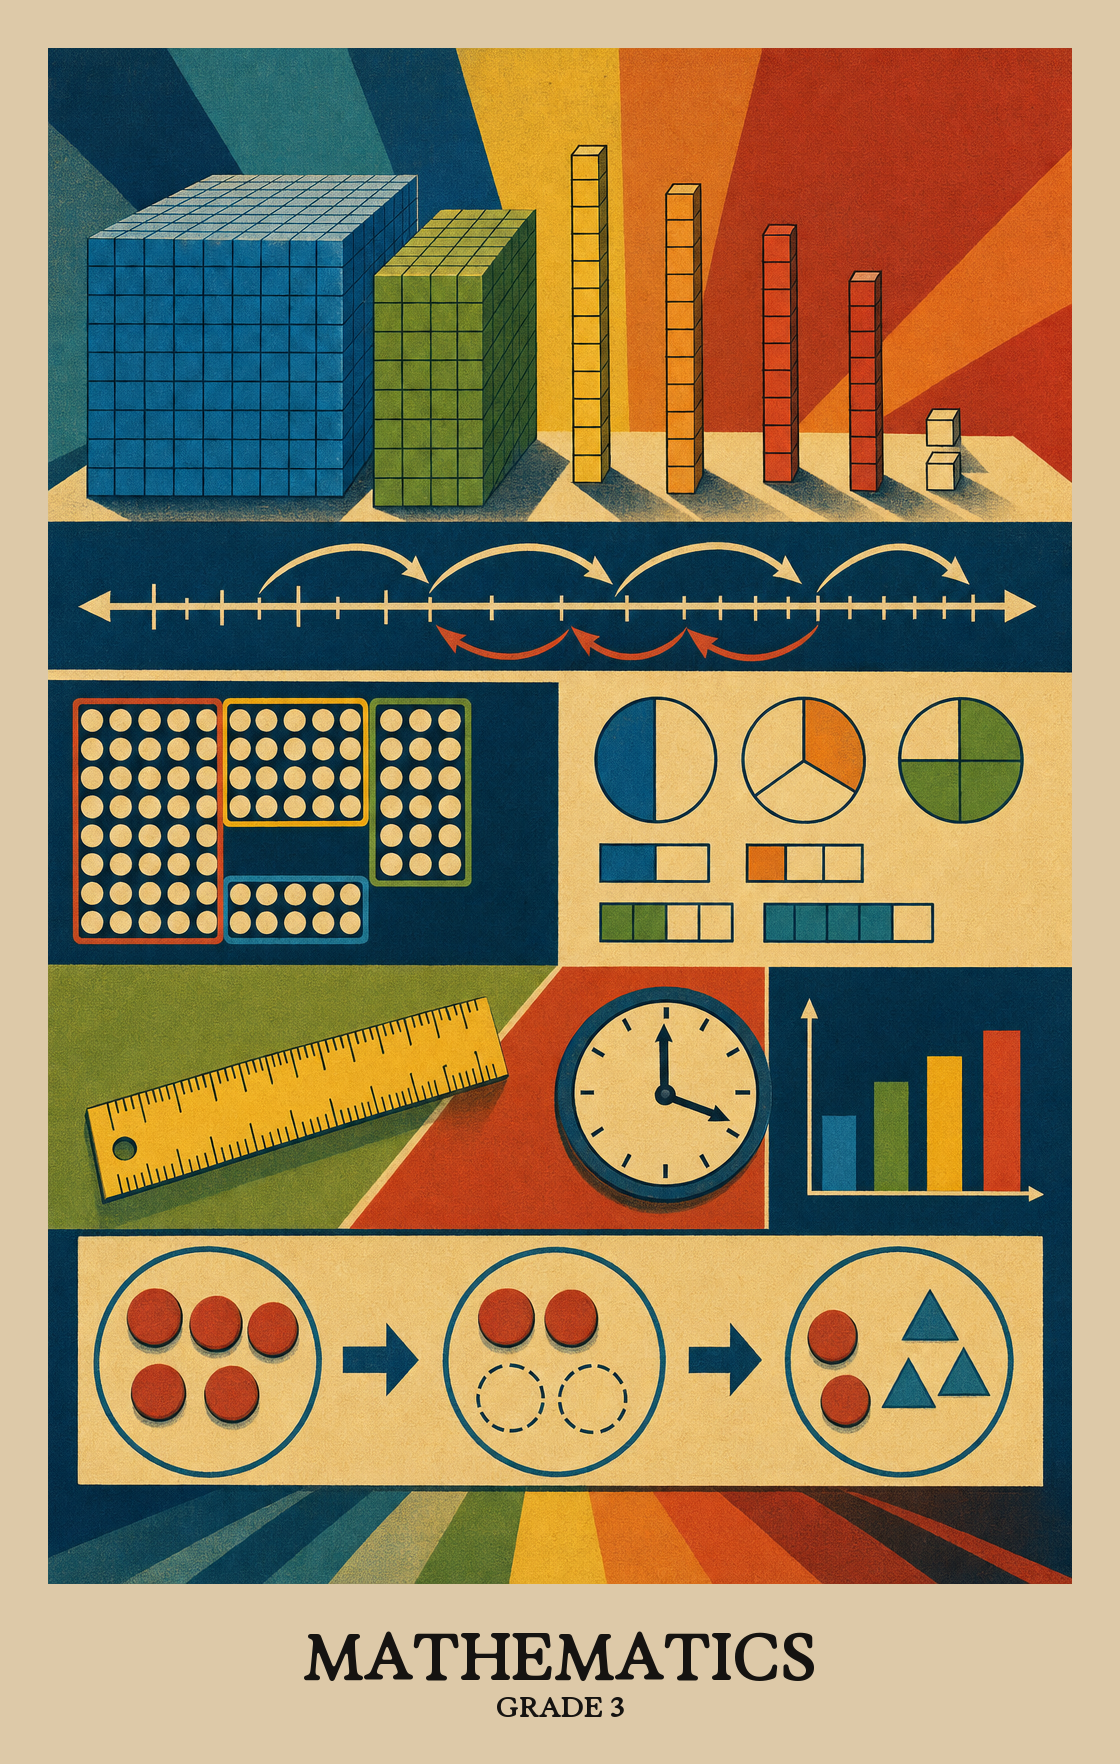
Students read, write, and compare numbers up to six digits. They learn what each digit is worth and put numbers in order from smallest to largest.
Students add and subtract numbers up to 1,000, including word problems with more than one step. They estimate first to check if an answer makes sense.
Students learn their times tables through 10 times 10 and the matching division facts. They use groups, arrays, and skip counting to solve word problems.
Students name, draw, and compare fractions like halves, thirds, and fourths. They also count bills and coins up to five dollars and make change.
Students measure length, weight, and liquid volume with rulers and cups. They tell time to the minute, find the distance around a shape, and name polygons like pentagons and hexagons.
Students collect data and show it on bar graphs and pictographs. They also spot growing and shrinking number patterns and figure out what comes next.
Reading and writing numbers up to 999,999, naming what each digit is worth. Students identify that in a number like 347,652, the 3 stands for 300,000, not just 3.
Students read and write numbers up to 999,999 in three ways: as a regular number (482,307), as an addition of each part (400,000 + 80,000 + 2,000 + 300 + 7), and spelled out in words.
Reading a six-digit number, students identify what each digit is worth based on its position. In 165,724, the 5 sits in the thousands place, so its value is 5,000.
Students break a number like 256 into hundreds, tens, and ones in more than one way. The same number can be split differently each time, as long as the pieces add up correctly.
Reading a four-digit number means knowing that the position of each digit tells you how much it's worth. Students compare and order numbers up to 9,999 by looking at place value, from thousands down to ones.
Students look at two numbers up to 9,999 and decide which is bigger, smaller, or equal. They write that comparison using symbols like > or < or in plain words.
Students put up to three numbers (each up to 9,999) in order from smallest to largest or largest to smallest, using written numbers or physical models like base-ten blocks.
Fractions show equal parts of a whole. Students read, write, and compare fractions and mixed numbers, deciding which is larger or smaller using denominators like 2, 4, 8, and 10, and explain how they know.
Students learn to show fractions like 3/4 or 1 1/2 by drawing shapes, marking number lines, and writing the numbers out. Denominators stay within common splits: halves, thirds, quarters, fifths, sixths, eighths, and tenths.
Students use shapes split into equal parts to show fractions. A circle cut into fourths or a rectangle divided into thirds are the kinds of pictures they draw and read.
Students use folded paper strips, fraction bars, and number lines to show fractions as pieces of a measured length. This connects the size of a fraction to a real distance students can see and touch.
Students use a group of objects, like chips or counters, to show fractions. If a set has 8 counters and 3 are shaded, that shaded portion represents three-eighths of the whole set.
A unit fraction is a fraction with 1 on top, like 1/4. Students look at a shaded shape or number line and name the fraction they see as a count of those single pieces, so 3/4 becomes 1/4 + 1/4 + 1/4.
Students count fractional pieces in a model to write the same amount two ways: as an improper fraction (like 5/4) and as a mixed number (like 1 and 1/4).
Students break a fraction into smaller parts and put parts back together to make a fraction, using pictures or diagrams to show the work. For example, six-eighths can be split into four-eighths and two-eighths.
Students decide whether a fraction is closer to zero, one-half, or a whole by looking at a shaded shape or a number line, and then by reasoning it out in their head.
Students compare two fractions that share the same top number, deciding which is greater, lesser, or equal. They use fraction bars, drawn shapes, or just reasoning to explain their answer.
Students compare two fractions that share the same denominator, deciding which is greater, lesser, or equal. They use words like "greater than" or symbols like > and <, and may draw a picture or work it out in their head.
Students show that two fractions are equal in value by drawing shapes split into equal parts or marking equal lengths on a number line.
Students count coins and bills, compare totals, and figure out how much change to give back, using amounts up to $5.00. Problems often come from everyday situations like buying something at a store.
Students count a mix of coins and bills, then name the total amount. The total is $5.00 or less.
Students pick bills and coins that add up to a given amount, no more than $5.00. They practice choosing different combinations that reach the same total.
Students look at two groups of coins or bills and decide which is worth more, less, or the same amount, then write it with words or symbols like > and <. Amounts stay at $5.00 or under.
Students figure out how much change to hand back after a purchase of $5.00 or less. They count up or count back using coins and bills, or by working through a picture of them.
| Standard | Definition | Code |
|---|---|---|
| The student will use place value understanding to read, write | Reading and writing numbers up to 999,999, naming what each digit is worth. Students identify that in a number like 347,652, the 3 stands for 300,000, not just 3. | 3.NS.1 |
| Read and write six-digit whole numbers in standard form, expanded form | Students read and write numbers up to 999,999 in three ways: as a regular number (482,307), as an addition of each part (400,000 + 80,000 + 2,000 + 300 + 7), and spelled out in words. | 3.NS.1.a |
| Apply patterns within the base 10 system to determine and communicate, orally… | Reading a six-digit number, students identify what each digit is worth based on its position. In 165,724, the 5 sits in the thousands place, so its value is 5,000. | 3.NS.1.b |
| Compose, decompose, and represent numbers up to 9,999 in multiple ways… | Students break a number like 256 into hundreds, tens, and ones in more than one way. The same number can be split differently each time, as long as the pieces add up correctly. | 3.NS.1.c |
| The student will demonstrate an understanding of the base 10 system to compare… | Reading a four-digit number means knowing that the position of each digit tells you how much it's worth. Students compare and order numbers up to 9,999 by looking at place value, from thousands down to ones. | 3.NS.2 |
| Compare two whole numbers, each 9,999 or less, using symbols | Students look at two numbers up to 9,999 and decide which is bigger, smaller, or equal. They write that comparison using symbols like > or < or in plain words. | 3.NS.2.a |
| Order up to three whole numbers, each 9,999 or less, represented with and… | Students put up to three numbers (each up to 9,999) in order from smallest to largest or largest to smallest, using written numbers or physical models like base-ten blocks. | 3.NS.2.b |
| The student will use mathematical reasoning and justification to represent and… | Fractions show equal parts of a whole. Students read, write, and compare fractions and mixed numbers, deciding which is larger or smaller using denominators like 2, 4, 8, and 10, and explain how they know. | 3.NS.3 |
| Represent, name, and write a given fraction | Students learn to show fractions like 3/4 or 1 1/2 by drawing shapes, marking number lines, and writing the numbers out. Denominators stay within common splits: halves, thirds, quarters, fifths, sixths, eighths, and tenths. | 3.NS.3.a |
| region/area models (e.g., pie pieces, pattern blocks, geoboards) | Students use shapes split into equal parts to show fractions. A circle cut into fourths or a rectangle divided into thirds are the kinds of pictures they draw and read. | 3.NS.3.a.i |
| length models (e.g., paper fraction strips, fraction bars, rods, number lines) | Students use folded paper strips, fraction bars, and number lines to show fractions as pieces of a measured length. This connects the size of a fraction to a real distance students can see and touch. | 3.NS.3.a.ii |
| set models (e.g., chips, counters, cubes) | Students use a group of objects, like chips or counters, to show fractions. If a set has 8 counters and 3 are shaded, that shaded portion represents three-eighths of the whole set. | 3.NS.3.a.iii |
| Identify a fraction represented by a model as the sum of unit fractions | A unit fraction is a fraction with 1 on top, like 1/4. Students look at a shaded shape or number line and name the fraction they see as a count of those single pieces, so 3/4 becomes 1/4 + 1/4 + 1/4. | 3.NS.3.b |
| Use a model of a fraction greater than one to count the fractional parts to… | Students count fractional pieces in a model to write the same amount two ways: as an improper fraction (like 5/4) and as a mixed number (like 1 and 1/4). | 3.NS.3.c |
| Compose and decompose fractions | Students break a fraction into smaller parts and put parts back together to make a fraction, using pictures or diagrams to show the work. For example, six-eighths can be split into four-eighths and two-eighths. | 3.NS.3.d |
| Compare a fraction, less than or equal to one, to the benchmarks of 0, 1 2 … | Students decide whether a fraction is closer to zero, one-half, or a whole by looking at a shaded shape or a number line, and then by reasoning it out in their head. | 3.NS.3.e |
| Compare two fractions | Students compare two fractions that share the same top number, deciding which is greater, lesser, or equal. They use fraction bars, drawn shapes, or just reasoning to explain their answer. | 3.NS.3.f |
| Compare two fractions | Students compare two fractions that share the same denominator, deciding which is greater, lesser, or equal. They use words like "greater than" or symbols like > and <, and may draw a picture or work it out in their head. | 3.NS.3.g |
| Represent equivalent fractions with denominators of 2, 3, 4, 5, 6, 8 | Students show that two fractions are equal in value by drawing shapes split into equal parts or marking equal lengths on a number line. | 3.NS.3.h |
| The student will solve problems, including those in context, that involve… | Students count coins and bills, compare totals, and figure out how much change to give back, using amounts up to $5.00. Problems often come from everyday situations like buying something at a store. | 3.NS.4 |
| Determine the value of a collection of bills and coins whose total is $5.00 or… | Students count a mix of coins and bills, then name the total amount. The total is $5.00 or less. | 3.NS.4.a |
| Construct a set of bills and coins to total a given amount of money whose value… | Students pick bills and coins that add up to a given amount, no more than $5.00. They practice choosing different combinations that reach the same total. | 3.NS.4.b |
| Compare the values of two sets of coins or two sets of bills and coins, up to… | Students look at two groups of coins or bills and decide which is worth more, less, or the same amount, then write it with words or symbols like > and <. Amounts stay at $5.00 or under. | 3.NS.4.c |
| Solve contextual problems to make change from $5.00 or less by using counting… | Students figure out how much change to hand back after a purchase of $5.00 or less. They count up or count back using coins and bills, or by working through a picture of them. | 3.NS.4.d |
Students add and subtract numbers up to 1,000, including word problems with a real-world situation. They also estimate before calculating to check whether their answer makes sense.
Students decide whether a problem calls for a ballpark number or an exact answer, then explain their reasoning. This comes up in real addition and subtraction situations with numbers up to 1,000.
Students round numbers to the nearest 10 or 100 to get a quick, close answer before solving addition or subtraction problems. The numbers involved stay below 1,000.
Students add and subtract numbers up to 1,000 using reliable methods, including the standard written procedure. They apply what they know about place value and number relationships to get the right answer.
Students learn that = means both sides of a math problem have the same value, and that the "not equal" sign (≠) means they don't. They practice deciding which symbol belongs between two addition or subtraction problems.
Students read a word problem and figure out whether to add or subtract, then solve it and explain how they got the answer. Numbers go up to 1,000.
Students practice multiplication and division facts up to 10 x 10 until they know them cold, then use those facts to solve real word problems and explain how they got the answer.
Students show what multiplication and division mean using pictures, groups, and number lines before memorizing the facts. They connect a problem like "3 groups of 4 apples" to the equation 3 × 4 = 12.
Given a multiplication fact like 6 × 7 = 42, students use the inverse relationship to write the matching division facts (42 ÷ 7 = 6 and 42 ÷ 6 = 7), showing how multiplication and division undo each other.
Students use shortcuts like breaking numbers apart or swapping the order of factors to make multiplication and division problems easier to solve.
Students use patterns and shortcuts to recall multiplication facts up to 10 x 10. For example, doubling a smaller fact or using a near square to figure out a close one.
Students read a short word problem and figure out whether to multiply or divide to solve it, using facts up to 10 times 10. They also explain how they know their answer makes sense.
Students know their times tables up to 10 times 10 by heart, and can quickly recall the matching division facts, like knowing that 6 times 7 is 42 also means 42 divided by 7 is 6.
Students write number sentences that show two multiplication or division expressions are equal, like 4 × 3 = 14 - 2. Both sides of the equals sign must balance.
| Standard | Definition | Code |
|---|---|---|
| The student will estimate, represent, solve | Students add and subtract numbers up to 1,000, including word problems with a real-world situation. They also estimate before calculating to check whether their answer makes sense. | 3.CE.1 |
| Determine and justify whether an estimate or an exact answer is appropriate… | Students decide whether a problem calls for a ballpark number or an exact answer, then explain their reasoning. This comes up in real addition and subtraction situations with numbers up to 1,000. | 3.CE.1.a |
| Apply strategies (e.g., rounding to the nearest 10 or 100, using compatible… | Students round numbers to the nearest 10 or 100 to get a quick, close answer before solving addition or subtraction problems. The numbers involved stay below 1,000. | 3.CE.1.b |
| Apply strategies (e.g., place value, properties of addition, other number… | Students add and subtract numbers up to 1,000 using reliable methods, including the standard written procedure. They apply what they know about place value and number relationships to get the right answer. | 3.CE.1.c |
| Identify and use the appropriate symbol to distinguish between expressions that… | Students learn that = means both sides of a math problem have the same value, and that the "not equal" sign (≠) means they don't. They practice deciding which symbol belongs between two addition or subtraction problems. | 3.CE.1.d |
| Represent, solve, and justify solutions to single-step and multistep contextual… | Students read a word problem and figure out whether to add or subtract, then solve it and explain how they got the answer. Numbers go up to 1,000. | 3.CE.1.e |
| The student will recall with automaticity multiplication and division facts… | Students practice multiplication and division facts up to 10 x 10 until they know them cold, then use those facts to solve real word problems and explain how they got the answer. | 3.CE.2 |
| Represent multiplication and division of whole numbers through 10 × 10… | Students show what multiplication and division mean using pictures, groups, and number lines before memorizing the facts. They connect a problem like "3 groups of 4 apples" to the equation 3 × 4 = 12. | 3.CE.2.a |
| Use inverse relationships to write the related facts connected to a given model… | Given a multiplication fact like 6 × 7 = 42, students use the inverse relationship to write the matching division facts (42 ÷ 7 = 6 and 42 ÷ 6 = 7), showing how multiplication and division undo each other. | 3.CE.2.b |
| Apply strategies (e.g., place value, the properties of multiplication and/or… | Students use shortcuts like breaking numbers apart or swapping the order of factors to make multiplication and division problems easier to solve. | 3.CE.2.c |
| Demonstrate fluency with multiplication facts through 10 × 10 by applying… | Students use patterns and shortcuts to recall multiplication facts up to 10 x 10. For example, doubling a smaller fact or using a near square to figure out a close one. | 3.CE.2.d |
| Represent, solve, and justify solutions to single-step contextual problems that… | Students read a short word problem and figure out whether to multiply or divide to solve it, using facts up to 10 times 10. They also explain how they know their answer makes sense. | 3.CE.2.e |
| Recall with automaticity the multiplication facts through 10 × 10 and the… | Students know their times tables up to 10 times 10 by heart, and can quickly recall the matching division facts, like knowing that 6 times 7 is 42 also means 42 divided by 7 is 6. | 3.CE.2.f |
| Create an equation to represent the mathematical relationship between… | Students write number sentences that show two multiplication or division expressions are equal, like 4 × 3 = 14 - 2. Both sides of the equals sign must balance. | 3.CE.2.g |
Students measure real objects by length, weight, and liquid volume using rulers, scales, and measuring cups. They work in both inches and centimeters, rounding to the nearest half or whole unit.
Students decide whether a rough guess or a precise measurement fits the situation, then pick the right unit (inches, feet, grams, liters) before measuring.
Students estimate and then measure the weight or mass of real objects using a scale, picking U.S. Customary units like pounds or metric units like grams, and recording the nearest whole or half unit.
Students measure how long objects are using inches, feet, yards, centimeters, and meters. They round to the nearest half inch or whole unit depending on the tool.
Students weigh objects and record the result in pounds or kilograms, rounding to the nearest whole unit.
Students measure how much liquid fits in a container using cups, pints, quarts, and gallons, then practice the same skill using liters.
Students estimate how long, heavy, or full something is, then measure it and check how close their guess was.
Students figure out how much space a shape covers (area) and how far it is around the outside (perimeter). They estimate, measure, and solve real problems using inches, feet, centimeters, and meters.
Students find the area of a shape by counting or multiplying the square units that cover its surface. This shows how much flat space a shape takes up, like counting how many square tiles cover a floor.
Area measures how much flat space a surface covers. Students describe and give examples of area in real situations, like figuring out how much tile covers a kitchen floor or how much grass fills a backyard.
Students count square units to find how much space a flat surface covers, then explain why their answer makes sense. This is an early step toward measuring floors, walls, and other real surfaces.
Students add up the lengths of all four sides of a shape to find its total distance around the outside. They practice this with real-world problems, using inches, feet, centimeters, and meters.
Perimeter is the total distance around the outside edge of a shape. Students find it in real situations, like figuring out how much fencing surrounds a yard or how much ribbon wraps around a picture frame.
Students measure the distance around a shape by adding up the length of each side. They also practice making a reasonable guess before measuring, then explain how they got their answer.
Students add up the lengths of every side of a shape to find its total distance around the outside. They also explain how they got their answer.
Students read a clock to the nearest minute and figure out how much time has passed between two events, as long as the gap is a whole number of hours within a 12-hour day.
Students read both analog and digital clocks and record the time down to the exact minute, not just the hour or half-hour.
Students read a written time like 4:38 or 12:51 and find the matching clock face or digital display. They practice this with times down to the exact minute, not just the quarter hour.
Students figure out how much time has passed between two events on a clock, like how long a soccer game lasted or when lunch ends if it started at noon. Problems stay within a.m. or p.m. and move in whole-hour jumps.
Given a start time and end time on a clock, students figure out how much time passed between the two.
Students figure out what time something ends by adding a number of whole hours to a start time. For example, if a movie starts at 2:00 and runs for 3 hours, students find that it ends at 5:00.
Students are given an ending time and told how many hours passed. They work backward on a clock to find when something started.
Students sort and describe flat shapes like triangles, squares, and pentagons. They also practice splitting a shape into smaller pieces or joining shapes to make a new one.
A polygon is a flat, closed shape made of straight sides that never cross each other. Students learn to spot what makes a shape a polygon: it must be closed, flat, and built from at least three straight lines.
Students sort shapes into two groups: polygons (closed figures made of straight sides) and everything else. They also explain how they know which group a shape belongs to.
Students look at shapes in different positions and name them by counting their sides, whether the shape appears in a math problem or a real-world picture.
Students spot real-world shapes, like stop signs, floor tiles, and yield signs, and name them by their number of sides. They practice recognizing triangles, quadrilaterals, pentagons, hexagons, and octagons outside of a textbook.
Students sort shapes by the number of sides and corners, grouping them as triangles, four-sided figures, and shapes with five, six, or eight sides. They explain what makes two shapes alike or different.
Students fit two or three triangles or four-sided shapes together and name the new shape they've made, such as a pentagon or hexagon.
Students cut a triangle or rectangle into two or three smaller shapes, then name each piece. A rectangle split down the middle becomes two smaller rectangles, or two triangles.
| Standard | Definition | Code |
|---|---|---|
| The student will reason mathematically using standard units | Students measure real objects by length, weight, and liquid volume using rulers, scales, and measuring cups. They work in both inches and centimeters, rounding to the nearest half or whole unit. | 3.MG.1 |
| Justify whether an estimate or an exact measurement is needed for a contextual… | Students decide whether a rough guess or a precise measurement fits the situation, then pick the right unit (inches, feet, grams, liters) before measuring. | 3.MG.1.a |
| Estimate and measure | Students estimate and then measure the weight or mass of real objects using a scale, picking U.S. Customary units like pounds or metric units like grams, and recording the nearest whole or half unit. | 3.MG.1.b |
| length of an object to the nearest U.S | Students measure how long objects are using inches, feet, yards, centimeters, and meters. They round to the nearest half inch or whole unit depending on the tool. | 3.MG.1.b.i |
| weight/mass of an object to the nearest U.S | Students weigh objects and record the result in pounds or kilograms, rounding to the nearest whole unit. | 3.MG.1.b.ii |
| liquid volume to the nearest U.S | Students measure how much liquid fits in a container using cups, pints, quarts, and gallons, then practice the same skill using liters. | 3.MG.1.b.iii |
| Compare estimates of length, weight/mass | Students estimate how long, heavy, or full something is, then measure it and check how close their guess was. | 3.MG.1.c |
| The student will use multiple representations to estimate and solve problems… | Students figure out how much space a shape covers (area) and how far it is around the outside (perimeter). They estimate, measure, and solve real problems using inches, feet, centimeters, and meters. | 3.MG.2 |
| Solve problems, including those in context, involving area | Students find the area of a shape by counting or multiplying the square units that cover its surface. This shows how much flat space a shape takes up, like counting how many square tiles cover a floor. | 3.MG.2.a |
| describe and give examples of area as a measurement in contextual situations | Area measures how much flat space a surface covers. Students describe and give examples of area in real situations, like figuring out how much tile covers a kitchen floor or how much grass fills a backyard. | 3.MG.2.a.i |
| estimate and determine the area of a given surface by counting the number of… | Students count square units to find how much space a flat surface covers, then explain why their answer makes sense. This is an early step toward measuring floors, walls, and other real surfaces. | 3.MG.2.a.ii |
| Solve problems, including those in context, involving perimeter | Students add up the lengths of all four sides of a shape to find its total distance around the outside. They practice this with real-world problems, using inches, feet, centimeters, and meters. | 3.MG.2.b |
| describe and give examples of perimeter as a measurement in contextual… | Perimeter is the total distance around the outside edge of a shape. Students find it in real situations, like figuring out how much fencing surrounds a yard or how much ribbon wraps around a picture frame. | 3.MG.2.b.i |
| estimate and measure the distance around a polygon | Students measure the distance around a shape by adding up the length of each side. They also practice making a reasonable guess before measuring, then explain how they got their answer. | 3.MG.2.b.ii |
| given the lengths of all sides of a polygon | Students add up the lengths of every side of a shape to find its total distance around the outside. They also explain how they got their answer. | 3.MG.2.b.iii |
| The student will demonstrate an understanding of the concept of time to the… | Students read a clock to the nearest minute and figure out how much time has passed between two events, as long as the gap is a whole number of hours within a 12-hour day. | 3.MG.3 |
| Tell and write time to the nearest minute, using analog and digital clocks | Students read both analog and digital clocks and record the time down to the exact minute, not just the hour or half-hour. | 3.MG.3.a |
| Match a written time | Students read a written time like 4:38 or 12:51 and find the matching clock face or digital display. They practice this with times down to the exact minute, not just the quarter hour. | 3.MG.3.b |
| Solve single-step contextual problems involving elapsed time in one-hour… | Students figure out how much time has passed between two events on a clock, like how long a soccer game lasted or when lunch ends if it started at noon. Problems stay within a.m. or p.m. and move in whole-hour jumps. | 3.MG.3.c |
| the starting time and the ending time, determine the amount of time that has… | Given a start time and end time on a clock, students figure out how much time passed between the two. | 3.MG.3.c.i |
| the starting time and amount of elapsed time in one-hour increments, determine… | Students figure out what time something ends by adding a number of whole hours to a start time. For example, if a movie starts at 2:00 and runs for 3 hours, students find that it ends at 5:00. | 3.MG.3.c.ii |
| the ending time and the amount of elapsed time in one-hour increments… | Students are given an ending time and told how many hours passed. They work backward on a clock to find when something started. | 3.MG.3.c.iii |
| The student will identify, describe, classify, compare, combine | Students sort and describe flat shapes like triangles, squares, and pentagons. They also practice splitting a shape into smaller pieces or joining shapes to make a new one. | 3.MG.4 |
| Describe a polygon as a closed plane figure composed of at least three line… | A polygon is a flat, closed shape made of straight sides that never cross each other. Students learn to spot what makes a shape a polygon: it must be closed, flat, and built from at least three straight lines. | 3.MG.4.a |
| Classify figures as polygons or not polygons and justify reasoning | Students sort shapes into two groups: polygons (closed figures made of straight sides) and everything else. They also explain how they know which group a shape belongs to. | 3.MG.4.b |
| Identify and describe triangles, quadrilaterals, pentagons, hexagons | Students look at shapes in different positions and name them by counting their sides, whether the shape appears in a math problem or a real-world picture. | 3.MG.4.c |
| Identify and name examples of polygons | Students spot real-world shapes, like stop signs, floor tiles, and yield signs, and name them by their number of sides. They practice recognizing triangles, quadrilaterals, pentagons, hexagons, and octagons outside of a textbook. | 3.MG.4.d |
| Classify and compare polygons | Students sort shapes by the number of sides and corners, grouping them as triangles, four-sided figures, and shapes with five, six, or eight sides. They explain what makes two shapes alike or different. | 3.MG.4.e |
| Combine no more than three polygons, where each has three or four sides | Students fit two or three triangles or four-sided shapes together and name the new shape they've made, such as a pentagon or hexagon. | 3.MG.4.f |
| Subdivide a three-sided or four-sided polygon into no more than three parts and… | Students cut a triangle or rectangle into two or three smaller shapes, then name each piece. A rectangle split down the middle becomes two smaller rectangles, or two triangles. | 3.MG.4.g |
Students gather information to answer a question, then sort it into a pictograph or bar graph and explain what the data shows.
Students come up with a question that can be answered by gathering real information, like "What is the most popular lunch in our class?" That question then drives what data they collect and show in a graph.
Students figure out what information they need to answer a question, then gather that data by polling classmates, observing, or using tallies. Each collection has 30 or fewer responses sorted into up to eight groups.
Students make a picture graph to show a set of data, choosing a symbol where each picture stands for 1, 2, 5, or 10 things. The finished graph needs a title, labeled axes, and a key explaining what each symbol means.
Students build a bar graph from a set of data, adding a title and labels for each axis. They choose a counting scale that fits the numbers, going up by 1s, 2s, 5s, or 10s.
Students read a pictograph or bar graph and explain what the data shows, including which category had the most or least and what the numbers mean. They share their findings out loud or in writing.
Students look at a completed graph and explain what the categories mean and what the data show overall, like noticing that most classmates preferred scrambled eggs out of all the options surveyed.
Students look at a finished bar graph or pictograph and spot what stands out: which category has the most, which has the least, and whether any two categories are equal.
Students look at a finished pictograph or bar graph and draw conclusions that go beyond what the numbers say, like guessing which item would be most popular if the survey grew larger.
Students look at their completed graph and draw a simple conclusion, like "most kids chose pizza" or "only a few liked broccoli," then use that pattern to make a reasonable guess about what a new result might be.
Students read a pictograph or bar graph, then use the numbers in it to solve addition and subtraction problems with one or two steps. The data is the starting point, not just something to look at.
| Standard | Definition | Code |
|---|---|---|
| The student will apply the data cycle | Students gather information to answer a question, then sort it into a pictograph or bar graph and explain what the data shows. | 3.PS.1 |
| Formulate questions that require the collection or acquisition of data | Students come up with a question that can be answered by gathering real information, like "What is the most popular lunch in our class?" That question then drives what data they collect and show in a graph. | 3.PS.1.a |
| Determine the data needed to answer a formulated question and collect or… | Students figure out what information they need to answer a question, then gather that data by polling classmates, observing, or using tallies. Each collection has 30 or fewer responses sorted into up to eight groups. | 3.PS.1.b |
| Organize and represent a data set using pictographs that include an appropriate… | Students make a picture graph to show a set of data, choosing a symbol where each picture stands for 1, 2, 5, or 10 things. The finished graph needs a title, labeled axes, and a key explaining what each symbol means. | 3.PS.1.c |
| Organize and represent a data set using bar graphs with a title and labeled… | Students build a bar graph from a set of data, adding a title and labels for each axis. They choose a counting scale that fits the numbers, going up by 1s, 2s, 5s, or 10s. | 3.PS.1.d |
| Analyze data represented in pictographs and bar graphs | Students read a pictograph or bar graph and explain what the data shows, including which category had the most or least and what the numbers mean. They share their findings out loud or in writing. | 3.PS.1.e |
| describe the categories of data and the data as a whole | Students look at a completed graph and explain what the categories mean and what the data show overall, like noticing that most classmates preferred scrambled eggs out of all the options surveyed. | 3.PS.1.e.i |
| identify parts of the data that have special characteristics, including… | Students look at a finished bar graph or pictograph and spot what stands out: which category has the most, which has the least, and whether any two categories are equal. | 3.PS.1.e.ii |
| make inferences about data represented in pictographs and bar graphs | Students look at a finished pictograph or bar graph and draw conclusions that go beyond what the numbers say, like guessing which item would be most popular if the survey grew larger. | 3.PS.1.e.iii |
| use characteristics of the data to draw conclusions about the data and make… | Students look at their completed graph and draw a simple conclusion, like "most kids chose pizza" or "only a few liked broccoli," then use that pattern to make a reasonable guess about what a new result might be. | 3.PS.1.e.iv |
| solve one- and two-step addition and subtraction problems using data from… | Students read a pictograph or bar graph, then use the numbers in it to solve addition and subtraction problems with one or two steps. The data is the starting point, not just something to look at. | 3.PS.1.e.v |
Students spot a number pattern that grows or shrinks, figure out the rule behind it, and use that rule to continue or create their own pattern. The pattern can come from a real-life situation and can be shown as a table, a picture, or a number sequence.
Students look at a pattern (a row of numbers, a number line, or a picture) and explain whether the amounts are going up or going down with each step.
Students look at a number pattern that grows or shrinks, figure out the rule (like "add 4 each time"), then use that rule to fill in missing numbers or continue the pattern.
Students use a number pattern to solve a real-world problem, such as figuring out how many chairs are needed if each row adds two more than the last.
Students make their own number patterns that grow bigger or shrink smaller, showing the same pattern using drawings, objects, or a number line.
Students look at the same number pattern shown two ways (such as a table and a list of numbers) and explain how both representations show the same rule.
| Standard | Definition | Code |
|---|---|---|
| The student will identify, describe, extend | Students spot a number pattern that grows or shrinks, figure out the rule behind it, and use that rule to continue or create their own pattern. The pattern can come from a real-life situation and can be shown as a table, a picture, or a number sequence. | 3.PFA.1 |
| Identify and describe increasing and decreasing patterns using various… | Students look at a pattern (a row of numbers, a number line, or a picture) and explain whether the amounts are going up or going down with each step. | 3.PFA.1.a |
| Analyze an increasing or decreasing pattern and generalize the change to extend… | Students look at a number pattern that grows or shrinks, figure out the rule (like "add 4 each time"), then use that rule to fill in missing numbers or continue the pattern. | 3.PFA.1.b |
| Solve contextual problems that involve identifying, describing | Students use a number pattern to solve a real-world problem, such as figuring out how many chairs are needed if each row adds two more than the last. | 3.PFA.1.c |
| Create increasing and decreasing patterns using objects, pictures, numbers | Students make their own number patterns that grow bigger or shrink smaller, showing the same pattern using drawings, objects, or a number line. | 3.PFA.1.d |
| Investigate and explain the connection between two different representations of… | Students look at the same number pattern shown two ways (such as a table and a list of numbers) and explain how both representations show the same rule. | 3.PFA.1.e |
Standards of Learning mathematics assessment for grades 3 through 8.
Shorter computer-adaptive mathematics growth assessments for grades 3 through 8, administered during the school year in addition to spring SOL tests.
Alternate assessment program for eligible students with significant cognitive disabilities, covering state-tested grades and subjects.
Students work with bigger numbers, up to six digits, and learn to multiply and divide through ten times ten. They also start fractions in a serious way, tell time to the minute, and solve problems with money up to five dollars.
Five minutes a day beats a long weekend session. Use flashcards, a deck of cards, or quick quizzes in the car for facts up to ten times ten. By the end of the year, students should answer most facts without counting or pausing.
Ask students to read it twice and draw a picture of what is happening. A simple sketch of groups, jumps on a number line, or a bar for the total often unlocks the problem faster than rereading the words.
Most teachers start with place value and addition and subtraction to 1,000, move into multiplication and division facts by midyear, then take on fractions, measurement, and data in the spring. Fractions need the most time, so protect those weeks.
Fractions greater than one, elapsed time, and the difference between area and perimeter trip up the most students. Plan to revisit each one in short bursts after the unit ends, not just during it.
Pull out coins or base-ten blocks and let students trade a ten for ten ones before subtracting. Doing it with objects a few times makes the written steps make sense. Then practice two or three problems a night, not a whole page.
By June, students should recall multiplication and division facts quickly, add and subtract within 1,000 on paper, compare fractions with the same top or bottom number, and solve problems involving time, money, area, and perimeter without much prompting.
Understanding comes first. Students should be able to fold paper, shade a shape, or mark a number line to show a fraction before they compare or add them. Memorizing rules without that picture rarely sticks.