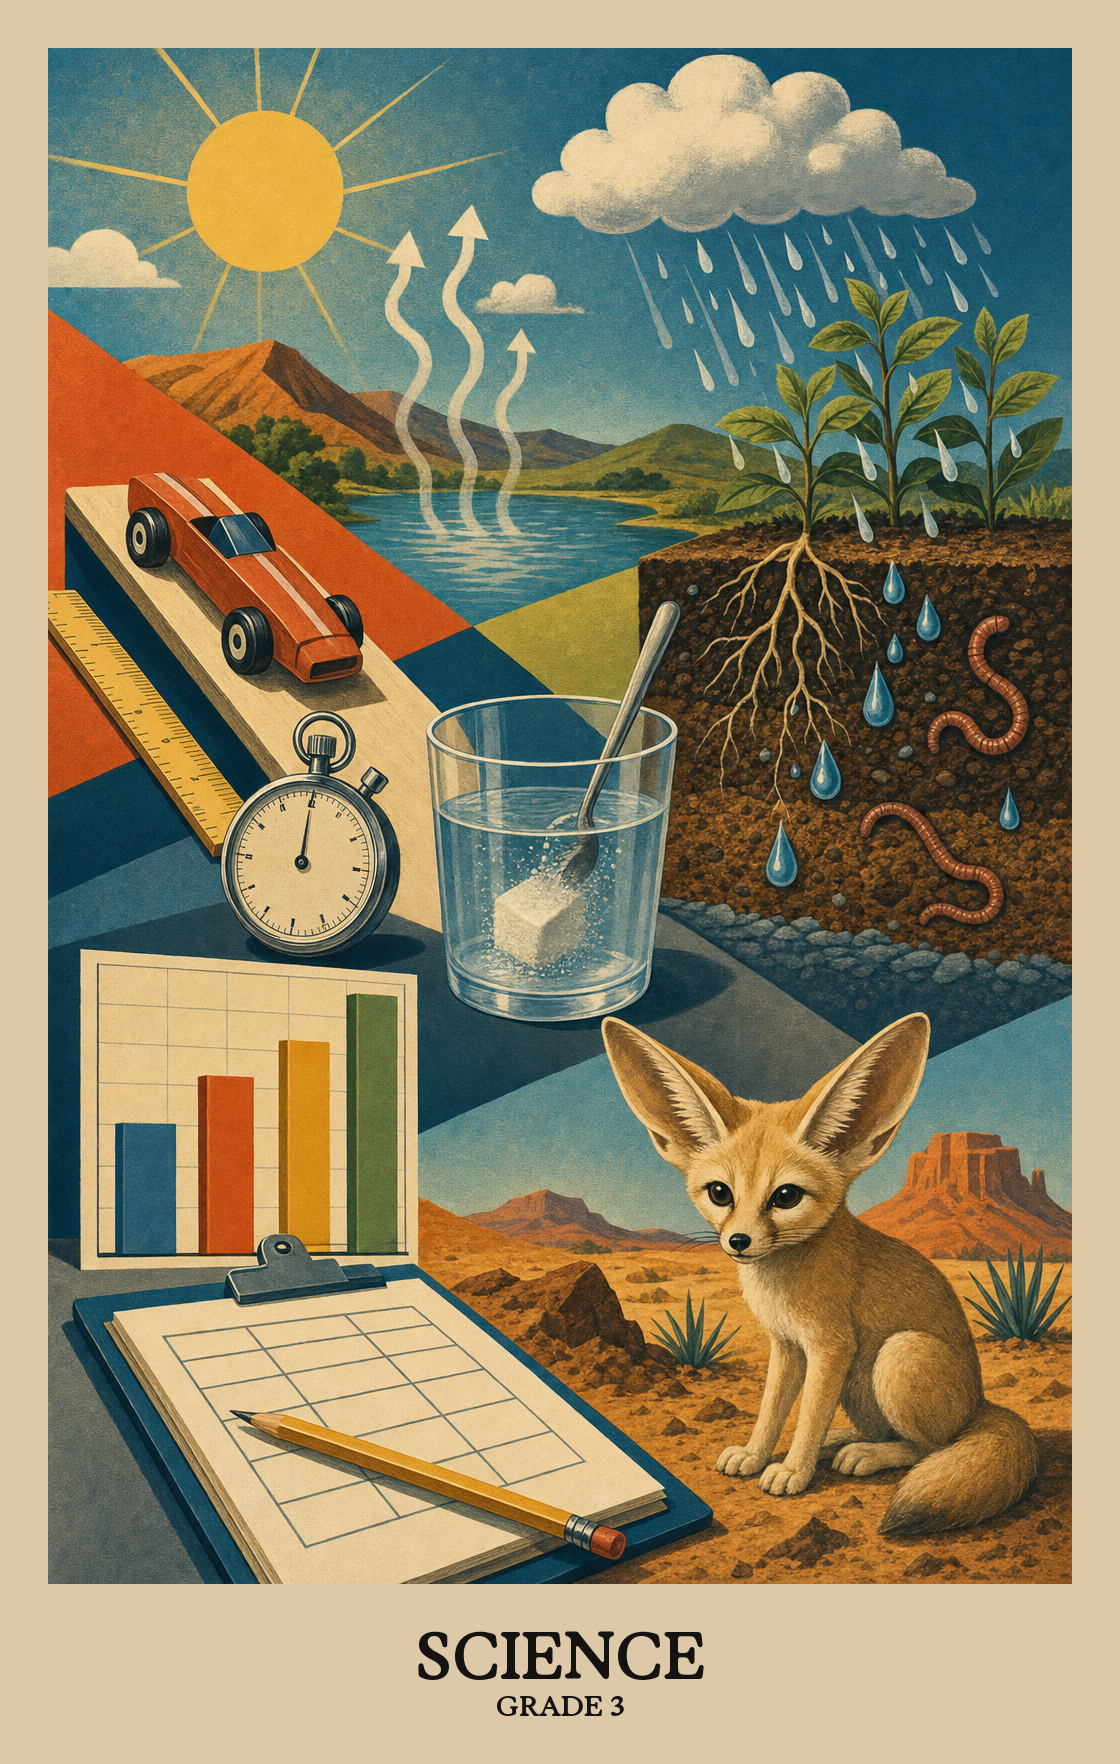
The student will demonstrate an understanding of scientific and engineering… | Reading a graph, measuring with a ruler, and asking "what if" questions are all part of scientific practice. In grade 3, students learn to plan simple investigations, record what they observe, and use their data to explain what happened. | 3.1 |
asking questions and defining problems | Students learn to ask clear questions about what they observe and put a problem into words precise enough to investigate or solve. | 3.1.a |
ask questions that can be investigated and predict reasonable outcomes | Students practice turning curiosity into testable questions, then predict what they think will happen before they investigate. | 3.1.a.i |
ask questions about what would happen if a variable is changed | Students learn to ask "what if" questions before running an experiment, such as wondering what would happen if a plant got more or less water. This is how scientists plan investigations before they test anything. | 3.1.a.ii |
define a simple design problem that can be solved through the development of an… | Students look at something that isn't working well and put the problem into words: what needs to change, and why the current situation falls short. That clear problem statement is the starting point for building or improving something. | 3.1.a.iii |
planning and carrying out investigations | Students design a simple test or experiment to answer a science question, then follow their plan and collect what they observe or measure. | 3.1.b |
with guidance, plan and conduct investigations | Students plan and run simple experiments with teacher guidance, deciding what to test and how to record what they find out. | 3.1.b.i |
use appropriate methods and/or tools for collecting data | Students choose the right tool for the job before collecting data, such as a ruler for length or a thermometer for temperature. The choice depends on what they are measuring. | 3.1.b.ii |
estimate length, mass, volume | Students practice making close-enough guesses for measurements like how long an object is, how heavy it feels, or how warm a liquid might be, before checking with a ruler, scale, or thermometer. | 3.1.b.iii |
measure length, mass, volume | Students measure length, mass, volume, and temperature using rulers, scales, measuring cups, and thermometers. They record readings in both metric units (centimeters, grams) and everyday U.S. units (inches, ounces). | 3.1.b.iv |
| | Students practice reading a clock or timer to find out how much time has passed during an experiment or activity. | 3.1.b.v |
use tools and/or materials to design and/or build a device that solves a… | Students pick tools and materials to build something that fixes a real problem. The focus is on making a working design, not just drawing one. | 3.1.b.vi |
| | Students look at data from an experiment, spot patterns, and decide what the results actually mean. | 3.1.c |
organize and represent data in pictographs or bar graphs | Reading a graph is one part of this skill. Students collect information from an experiment or observation, then sort it into a pictograph or bar graph so patterns are easier to see. | 3.1.c.i |
read, interpret, and analyze data represented in pictographs and bar graphs | Students read bar graphs and pictographs, then explain what the data shows and what patterns or differences stand out. | 3.1.c.ii |
analyze data from tests of an object or tool to determine if it works as… | Students look at test results to decide whether an object or tool did what it was supposed to do. If it didn't work as expected, that data points toward what needs fixing. | 3.1.c.iii |
constructing and critiquing conclusions and explanations | Students look at evidence from an experiment, write a conclusion that explains what they found, and then check whether their explanation actually holds up. | 3.1.d |
use evidence (measurements, observations, patterns) to construct or support an… | Students look at measurements and patterns from an investigation and use what they find to explain why something happened. The explanation has to be backed by actual evidence, not a guess. | 3.1.d.i |
generate and/or compare multiple solutions to a problem | Students think up more than one way to solve a problem, then compare those ideas to find which solution works best. | 3.1.d.ii |
describe how scientific ideas apply to design solutions | Students explain how a science concept (like how water flows or how forces push and pull) helped engineers solve a real problem. The focus is on connecting what scientists discovered to how a product or structure was built. | 3.1.d.iii |
developing and using models | Students build or draw models to show how something works or looks, then use those models to explain their thinking or make predictions. | 3.1.e |
use models to demonstrate simple phenomena and natural processes | Students build or draw a simple model, like a diagram of the water cycle or a paper bridge, to show how something in nature works. | 3.1.e.i |
develop a model (e.g., diagram or simple physical prototype) to illustrate a… | Students sketch or build a simple model, like a drawing or small mock-up, to show how a proposed object or tool would work before it's actually made. | 3.1.e.ii |
| | Students find information from books, videos, or other sources, then decide if it answers their question and share what they learned with others. | 3.1.f |
read and comprehend reading-level appropriate texts and/or other reliable media | Students read science articles, books, and reliable websites that match their grade level to learn about the natural world. | 3.1.f.i |
communicate scientific information, design ideas, and/or solutions with others | Students share what they found or built by talking, writing, or drawing so others can understand their work. This is how scientists and engineers check each other's ideas. | 3.1.f.ii |